Fig. 2
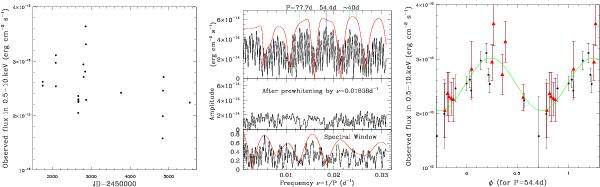
Left: evolution of the observed XMM-Newton fluxes of Tr16-22 with time (for the 4T fits). Middle: periodogram and spectral window for the whole dataset (black curve) and 2003 dataset (red curve) of these fluxes. Right: evolution of these fluxes when phasing with a frequency of 0.01838 d-1. Red triangles correspond to the 2003 data and the green line to the best-fit sinusoid.
Current usage metrics show cumulative count of Article Views (full-text article views including HTML views, PDF and ePub downloads, according to the available data) and Abstracts Views on Vision4Press platform.
Data correspond to usage on the plateform after 2015. The current usage metrics is available 48-96 hours after online publication and is updated daily on week days.
Initial download of the metrics may take a while.