Fig. 6
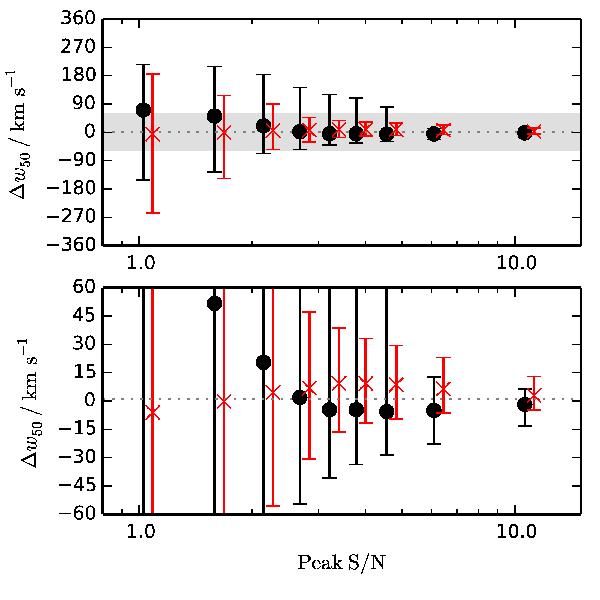
Median and 95% confidence regions for the error in w50 for both the classical method (black circles) and our bilateral filtering approach (red crosses) as a function of peak signal-to-noise ratio. Both panels show the same data but at different zoom scales. The shaded region in the top panel indicates the range in Δw50 shown in the bottom panel. The red crosses have been offset slightly for clarity.
Current usage metrics show cumulative count of Article Views (full-text article views including HTML views, PDF and ePub downloads, according to the available data) and Abstracts Views on Vision4Press platform.
Data correspond to usage on the plateform after 2015. The current usage metrics is available 48-96 hours after online publication and is updated daily on week days.
Initial download of the metrics may take a while.