Fig. 11
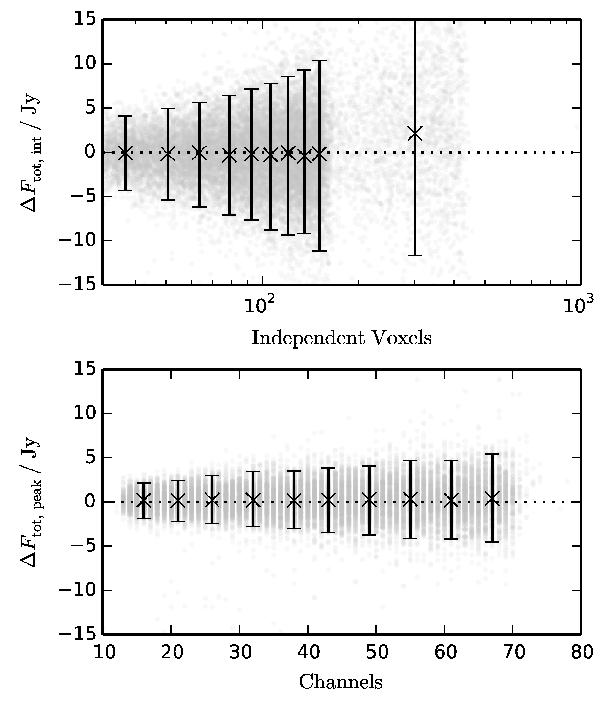
Top panel: absolute error in the total flux as a function of the number of independent voxels as measured from the integrated spectrum. The crosses and error bars indicate the median and the 95% confidence region. The gray dots show the distribution of the individual measurements. Bottom panel: absolute error in the total flux as a function of the number of independent voxels as measured from the peak spectrum. Gray dots, crosses, and error bars have the same meaning as above.
Current usage metrics show cumulative count of Article Views (full-text article views including HTML views, PDF and ePub downloads, according to the available data) and Abstracts Views on Vision4Press platform.
Data correspond to usage on the plateform after 2015. The current usage metrics is available 48-96 hours after online publication and is updated daily on week days.
Initial download of the metrics may take a while.