Fig. 2
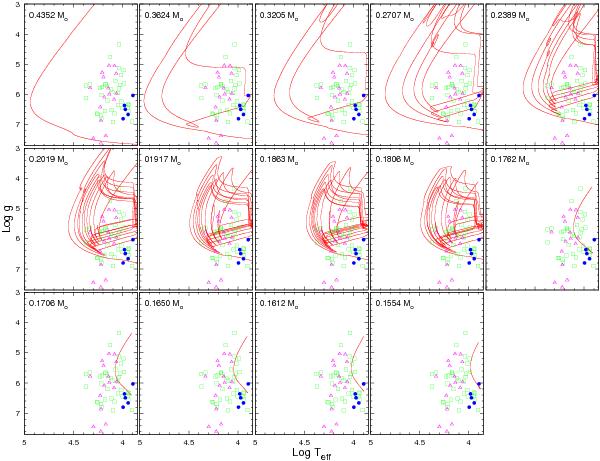
log Teff − log g diagrams for the He-core WD sequences computed in Althaus et al. (2013). Sequences with masses in the range 0.18 ≲ M∗ ≲ 0.4 undergo CNO flashes during the early-cooling phase, which leads to the complex loops in the diagram. Green squares and magenta triangles correspond to the observed post-RGB low-mass stars from Silvotti et al. (2012) and Brown et al. (2013), and filled blue circles correspond to the five pulsating low-mass WDs detected so far (Hermes et al. 2013a). Numbers in the left upper corner of each panel correspond to the stellar mass at the WD stage.
Current usage metrics show cumulative count of Article Views (full-text article views including HTML views, PDF and ePub downloads, according to the available data) and Abstracts Views on Vision4Press platform.
Data correspond to usage on the plateform after 2015. The current usage metrics is available 48-96 hours after online publication and is updated daily on week days.
Initial download of the metrics may take a while.