Fig. 7
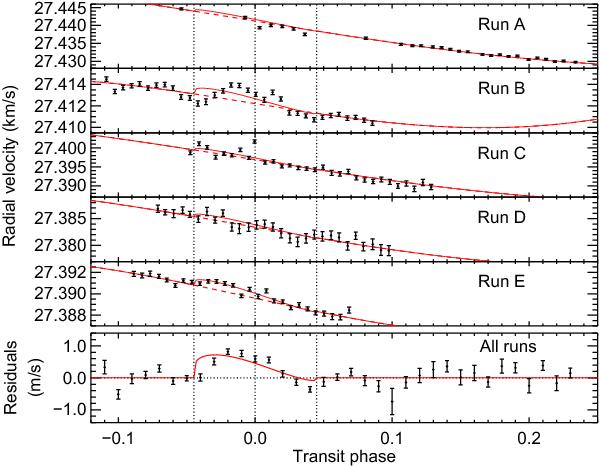
Best model of the RM anomaly when fitting Datasets A to E simultaneously. Black points show radial velocity measurements as a function of the orbital phase (see Table 4), overlaid with the five-planet Keplerian fit ignoring the transit (dashed, red line), and the final fit including the model of the RM anomaly (solid, red line). Vertical dotted lines show the times of mid-transit, first, and fourth contacts. The simultaneous fit to the five runs provides similar results to the fit to Run E alone. The bottom panel shows the error-weighted average of the Keplerian residuals over all runs (residuals from the Keplerian fit are first calculated in each run and grouped in common phase bins of width 0.01). Although the combined residuals are dominated by systematic errors, the RM anomaly is clearly visible.
Current usage metrics show cumulative count of Article Views (full-text article views including HTML views, PDF and ePub downloads, according to the available data) and Abstracts Views on Vision4Press platform.
Data correspond to usage on the plateform after 2015. The current usage metrics is available 48-96 hours after online publication and is updated daily on week days.
Initial download of the metrics may take a while.