Fig. 6
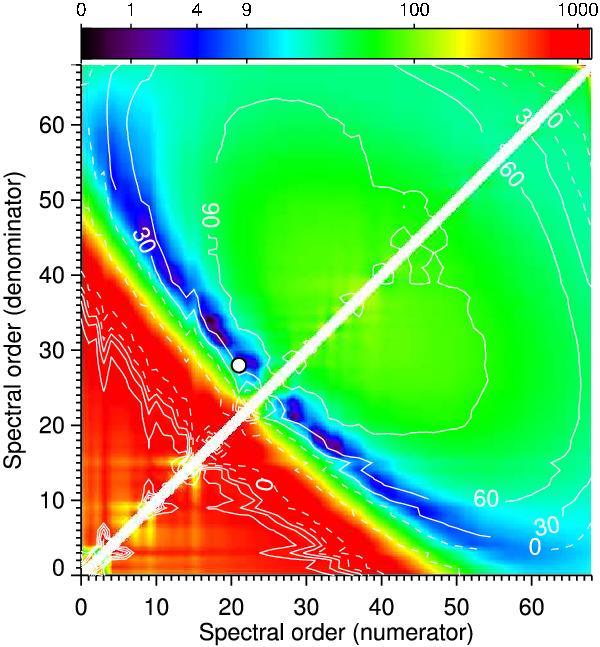
Dependence of the RM anomaly fit on the spectral orders used to compute the color-effect correction (Run E). Two different spectral orders must be used to quantify the color, which explains the white diagonal line where no fits can be done. White contours show the spin-orbit angles obtained for each color ratio (solid lines for positive values, dashed lines for negative values). The colorscale corresponds to the χ2 difference with respect to the best fit, obtained with the spectral orders 21 and 28 (white disk) and λ = 72.4°. Color ratios in the red part of the diagram show no significant correlation between the residuals of the Keplerian fit and the color ratio. Fits at less than about 3σ from the best fit are found in the localized blue area.
Current usage metrics show cumulative count of Article Views (full-text article views including HTML views, PDF and ePub downloads, according to the available data) and Abstracts Views on Vision4Press platform.
Data correspond to usage on the plateform after 2015. The current usage metrics is available 48-96 hours after online publication and is updated daily on week days.
Initial download of the metrics may take a while.