Fig. 4
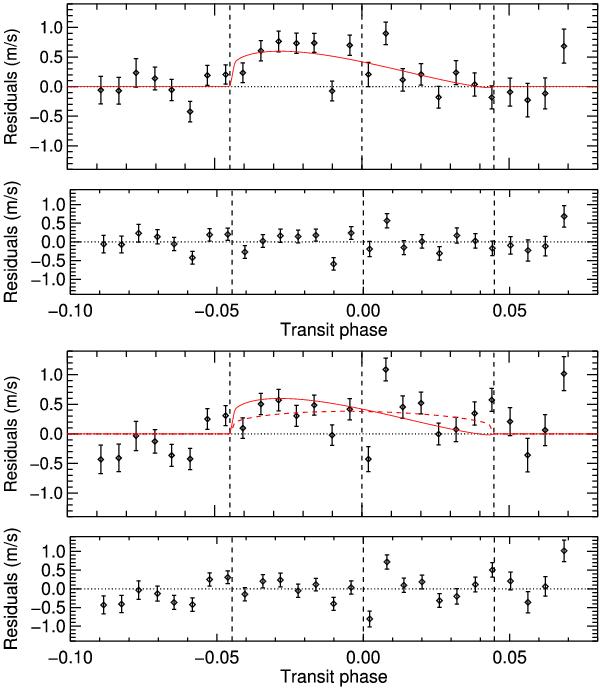
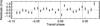
Upper panels: residuals from the Keplerian fit in Dataset E (black diamonds), after the empirical color-effect correction; (top). The dispersion outside the transit is 28 cm/s. The solid red line shows the best fit of the Rossiter-McLaughlin anomaly with  . The residuals to the Keplerian + RM fit over the entire sequence yield a dispersion of 28 cm/s (bottom). Vertical dashed lines indicate the times of mid-transit, first, and fourth contacts. Lower panels: residuals from the Keplerian fit after the DRS standard color-effect correction (top). The dispersion outside the transit is 43 cm/s. The dashed red line shows the best fit of the Rossiter-McLaughlin anomaly with
  , in agreement with the best-fit obtained after the empirical correction (solid red line as in the upper panels). The DRS-corrected residuals to the Keplerian + RM fit over the entire sequence yield a dispersion of 39 cm/s (bottom). Thus, both the Keplerian fit and the RM fit are better when using the empirical correction rather than the DRS correction.
Current usage metrics show cumulative count of Article Views (full-text article views including HTML views, PDF and ePub downloads, according to the available data) and Abstracts Views on Vision4Press platform.
Data correspond to usage on the plateform after 2015. The current usage metrics is available 48-96 hours after online publication and is updated daily on week days.
Initial download of the metrics may take a while.