Fig. 1
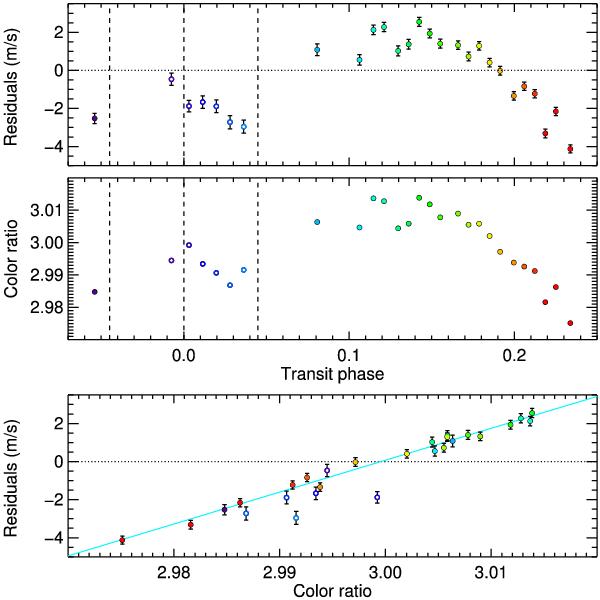
Top: residuals from the Keplerian fit in Dataset A as a function of
orbital phase. Vertical dashed lines show the times of mid-transit, first, and fourth
contacts. The colors of the plotted circles indicate the orbital phases of each
observation. Middle: color ratio
 as a function of orbital phase. There is a clear correlation with the RV residuals.
The decrease in the color ratio at the end of the sequence is mainly due to the
increase in the airmass. Bottom: linear relation between the
residuals of the Keplerian fit and the color ratio. The fit is performed on the
measurements outside of the transit (filled circles); those in the transit (empty
circles) roughly follow the same trend.
as a function of orbital phase. There is a clear correlation with the RV residuals.
The decrease in the color ratio at the end of the sequence is mainly due to the
increase in the airmass. Bottom: linear relation between the
residuals of the Keplerian fit and the color ratio. The fit is performed on the
measurements outside of the transit (filled circles); those in the transit (empty
circles) roughly follow the same trend.
Current usage metrics show cumulative count of Article Views (full-text article views including HTML views, PDF and ePub downloads, according to the available data) and Abstracts Views on Vision4Press platform.
Data correspond to usage on the plateform after 2015. The current usage metrics is available 48-96 hours after online publication and is updated daily on week days.
Initial download of the metrics may take a while.