Fig. 6
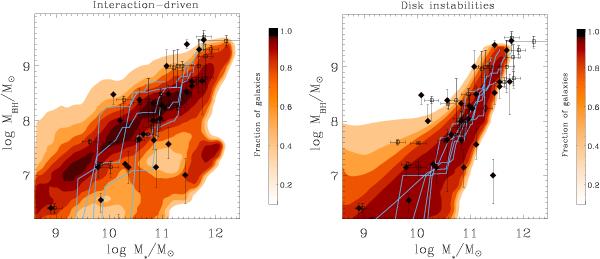
Local MBH − M∗ relation for the IT model (left panels) and the DI model (right panels). Data points represent the observed local relation from Häring & Rix (2004, diamonds), and Marconi & Hunt (2003, squares, here M∗ is derived using the best-fitting virial relation of Cappellari et al. 2006); the colour code represents the fraction of AGN as a function of MBH for any given value of M∗, as indicated by the colour bar. We also show some of the paths in the MBH(t) − M∗(t) plane followed, during their evolution, by BHs (and by their host galaxies) reaching a final mass of MBH(z = 0) ≥ 109 M⊙.
Current usage metrics show cumulative count of Article Views (full-text article views including HTML views, PDF and ePub downloads, according to the available data) and Abstracts Views on Vision4Press platform.
Data correspond to usage on the plateform after 2015. The current usage metrics is available 48-96 hours after online publication and is updated daily on week days.
Initial download of the metrics may take a while.