Free Access
Fig. 5
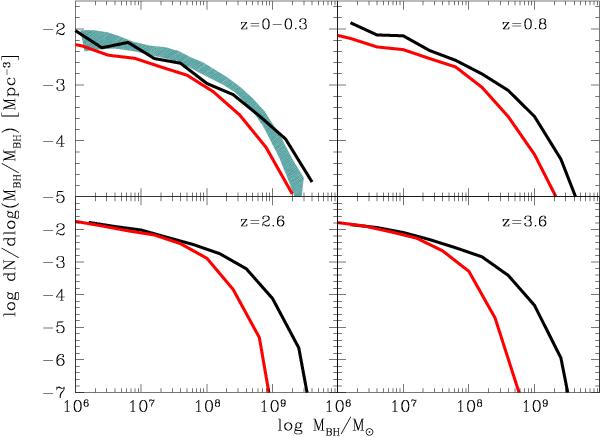
Predicted evolution of the BH mass function in the IT scenario (solid black lines) and in the DI model (solid red line). The shaded region defines the spread in observational estimates obtained using different methods, as compiled by Shankar et al. (2009).
Current usage metrics show cumulative count of Article Views (full-text article views including HTML views, PDF and ePub downloads, according to the available data) and Abstracts Views on Vision4Press platform.
Data correspond to usage on the plateform after 2015. The current usage metrics is available 48-96 hours after online publication and is updated daily on week days.
Initial download of the metrics may take a while.