Fig. 2
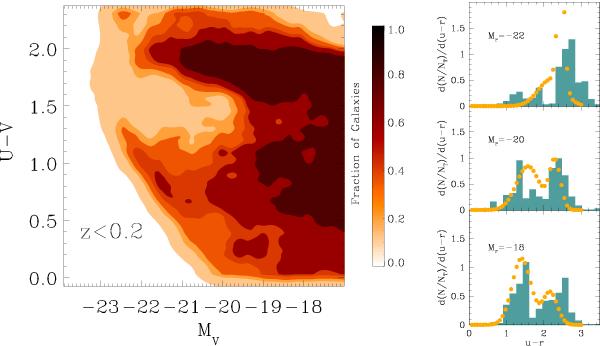
Left panel: predicted local colour–magnitude relation. The colour code represents the number density of galaxies, normalized to the maximum value. Right panels: predicted colour distribution (differential number of objects per colour bin, normalized to the total number) for galaxies of different magnitudes (histograms) is compared with the data from the SDSS (Baldry et al. 2004, dots).
Current usage metrics show cumulative count of Article Views (full-text article views including HTML views, PDF and ePub downloads, according to the available data) and Abstracts Views on Vision4Press platform.
Data correspond to usage on the plateform after 2015. The current usage metrics is available 48-96 hours after online publication and is updated daily on week days.
Initial download of the metrics may take a while.