Fig. 1
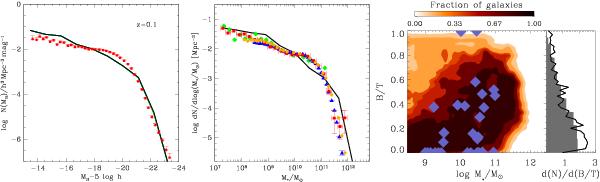
Left panel: predicted luminosity function at z ≤ 0.1 (in bj band, solid line) compared with observations from Jones et al. (2006). Central panel: predicted local stellar mass function (solid line) compared with data from Baldry et al. (2012, squares), Li & White (2009, triangles), Panter et al. (2007, circles), and Fontana et al. (2006, diamonds). Right panel: the contour plot shows the predicted relative fraction of bulge-to-total mass as a function of the galaxy stellar mass. This is compared with data from Fisher & Drory (2011). The corresponding distribution of B/T ratios (differential number of objects per B/T bin, normalized to the total number, solid line) is also compared with the SDSS data (Lackner & Gunn 2012, shaded histogram) in the rightmost panel, for galaxies in the magnitude range −24 ≤ Mr ≤ −17.
Current usage metrics show cumulative count of Article Views (full-text article views including HTML views, PDF and ePub downloads, according to the available data) and Abstracts Views on Vision4Press platform.
Data correspond to usage on the plateform after 2015. The current usage metrics is available 48-96 hours after online publication and is updated daily on week days.
Initial download of the metrics may take a while.