Fig. 2
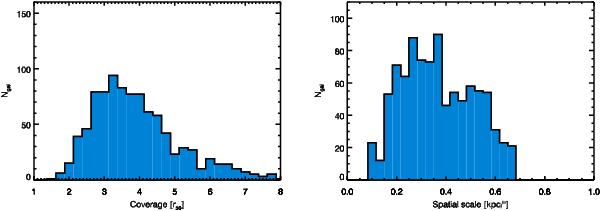
Left: histogram of radial coverages of the CALIFA galaxies, i.e. the ratio between the radius of the Field of View of PPak and petroR50r. This figure does not give the actual spectroscopic coverage, which may be smaller due to S/N issues. Right: histogram of spatial scales with which the CALIFA galaxies are observed. A fibre diameter is 2.7′′, whereas the typical fibre-to-fibre distance is 3′′. The final spatial resolution of CALIFA will depend on future optimizations of the cubing code, but will be approximately 3′′.

Current usage metrics show cumulative count of Article Views (full-text article views including HTML views, PDF and ePub downloads, according to the available data) and Abstracts Views on Vision4Press platform.
Data correspond to usage on the plateform after 2015. The current usage metrics is available 48-96 hours after online publication and is updated daily on week days.
Initial download of the metrics may take a while.