Fig. 17
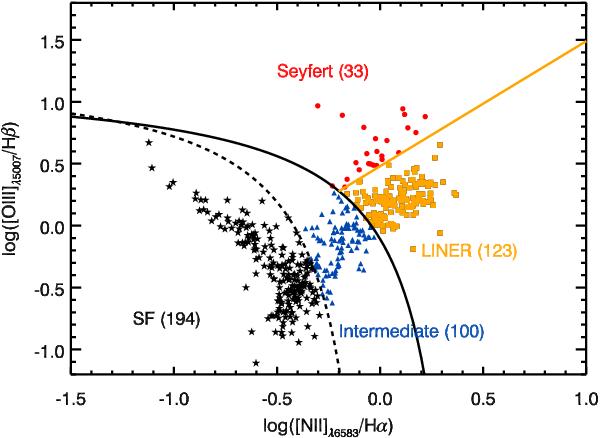
Standard emission-line diagnostic diagram for CALIFA galaxies with SDSS spectra. Only spectra centered on the galaxy nucleus (<3′′) and with S/N > 3 in all emission lines are shown here. The demarcation lines by Kewley et al. (2001; black), Kauffmann et al. (2003b; black dotted), and Cid Fernandes et al. (2010; yellow) are used to characterize the objects into star forming (black), Seyferts (red), SF/AGN intermediates (blue), and LINER-like (orange) objects. The number of objects per class is indicated on the plot.
Current usage metrics show cumulative count of Article Views (full-text article views including HTML views, PDF and ePub downloads, according to the available data) and Abstracts Views on Vision4Press platform.
Data correspond to usage on the plateform after 2015. The current usage metrics is available 48-96 hours after online publication and is updated daily on week days.
Initial download of the metrics may take a while.