Fig. 10
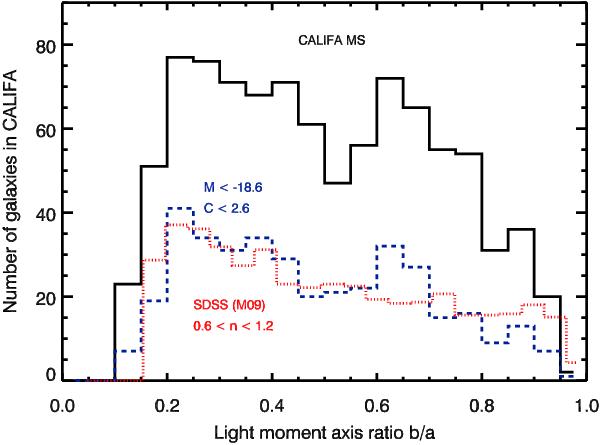
Histogram of axis ratios (2nd order moments of the r band light distribution) for the CALIFA MS. Overplotted in blue is the histogram for disc-dominated systems with Mr,p < −18.6 and concentration indices c < 2.6, and in red for comparison the axis ratio distribution (rescaled to the same number of objects) for the disc-dominated galaxies in the SDSS sample of Maller et al. (2009).
Current usage metrics show cumulative count of Article Views (full-text article views including HTML views, PDF and ePub downloads, according to the available data) and Abstracts Views on Vision4Press platform.
Data correspond to usage on the plateform after 2015. The current usage metrics is available 48-96 hours after online publication and is updated daily on week days.
Initial download of the metrics may take a while.