Fig. 1
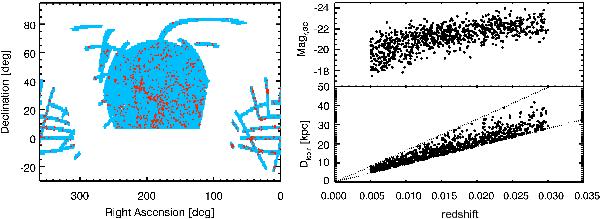
Left panel: the footprint on the sky of our search in the DR7 CAS (light blue) and the distribution of the 939 galaxies constituting the CALIFA mother sample (red circles). Right panels: redshifts vs. absolute magnitudes Mr,GC (top) and r-band linear isophotal sizes (bottom) for the galaxies in the sample. The dotted lines in the lower panel are the selection limits.
Current usage metrics show cumulative count of Article Views (full-text article views including HTML views, PDF and ePub downloads, according to the available data) and Abstracts Views on Vision4Press platform.
Data correspond to usage on the plateform after 2015. The current usage metrics is available 48-96 hours after online publication and is updated daily on week days.
Initial download of the metrics may take a while.