Fig. 5
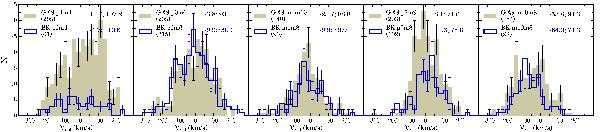
Velocity distributions (heliocentric, in km s-1) for the five program fields shown as filled histograms. We consider here only the stars kept in our final selection. For the p1m4 field, we exclude the stars identified as possible globular cluster members (see main text). For comparison, we overplot the velocity distributions of BRAVA data (blue solid line) of the corresponding or nearest available field as indicated in each box. The number of stars (in brackets) and the mean and σ values for each group of data are also quoted.
Current usage metrics show cumulative count of Article Views (full-text article views including HTML views, PDF and ePub downloads, according to the available data) and Abstracts Views on Vision4Press platform.
Data correspond to usage on the plateform after 2015. The current usage metrics is available 48-96 hours after online publication and is updated daily on week days.
Initial download of the metrics may take a while.