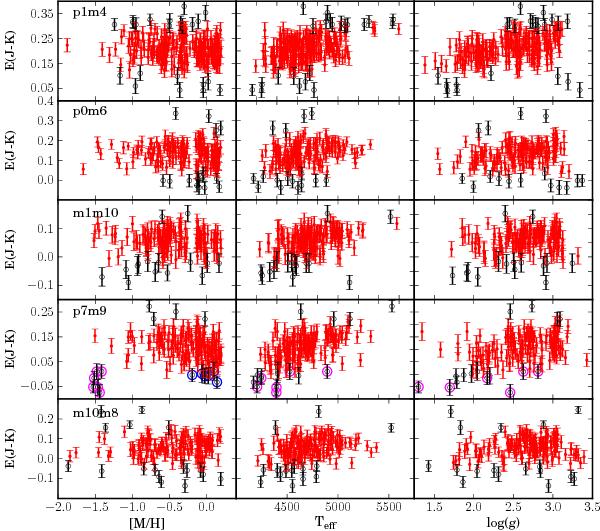
Fig. 3

Distribution of estimated reddening values for each field (rows) with respect to the atmospheric parameters (columns). Red points and black circles represent values selected and clipped using median absolute deviation statistics. Error bars are computed using Monte Carlo simulations, as described in the main text. In the p7m9 field, blue points mark the high-metallicity bulk of clipped points, while magenta highlights stars clumped out of the general trend of this field.
Current usage metrics show cumulative count of Article Views (full-text article views including HTML views, PDF and ePub downloads, according to the available data) and Abstracts Views on Vision4Press platform.
Data correspond to usage on the plateform after 2015. The current usage metrics is available 48-96 hours after online publication and is updated daily on week days.
Initial download of the metrics may take a while.


