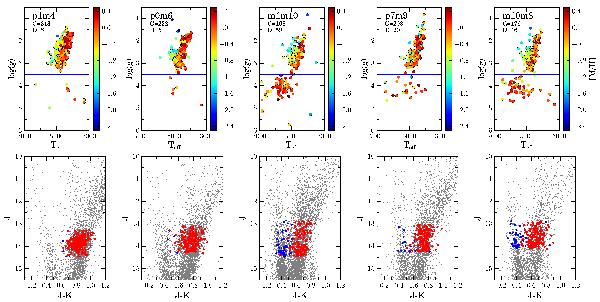
Fig. 2

Upper panels: HR diagrams for the five bulge fields constructed from the stellar parameters obtained as described in the text, and color-coded according to the metallicity [M/H] . Our adopted limit for giants (log g≤3.5 dex) is marked by a horizontal blue solid line in each panel. Lower panels: J vs. (J − Ks) color−magnitude diagrams constructed from VVV VISTA photometry, completed with 2MASS for stars brighter than Ks = 12 mag, where VVV magnitudes start to saturate. The different selected samples are apparent from the distribution of observations (colored points) in the bulge RC and MS regions in each field, color-coded according to the stellar gravity as dwarfs (blue) and giants (red).
Current usage metrics show cumulative count of Article Views (full-text article views including HTML views, PDF and ePub downloads, according to the available data) and Abstracts Views on Vision4Press platform.
Data correspond to usage on the plateform after 2015. The current usage metrics is available 48-96 hours after online publication and is updated daily on week days.
Initial download of the metrics may take a while.


