Fig. 11
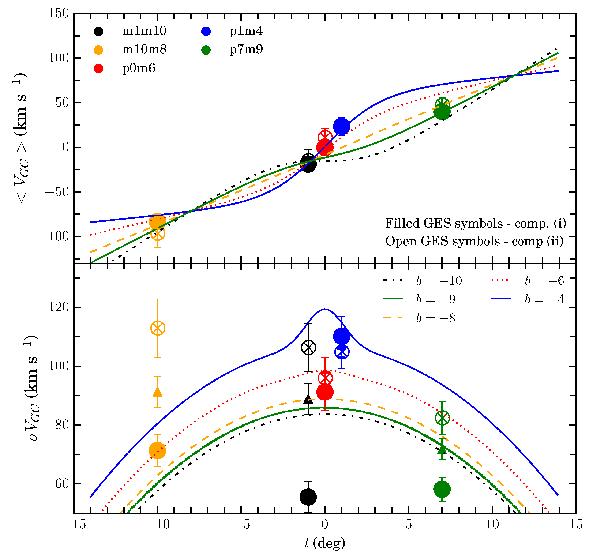
Rotation curve (top) and velocity dispersion profile (bottom) for our fields. A set of curves computed from the GIBS kinematical maps are displayed using colors corresponding to the latitude of each field. To split stars into metallicity components, we adopt values tuned in each MDF, as presented in Sect. 7; [M/H] = − 0.1 dex for p0m6 and p7m9, −0.2 dex for m1m10, and −0.5 dex for m10m8. Filled and open symbols represent component (i) and (ii). Triangle colored symbols stand for the respective complete field samples.
Current usage metrics show cumulative count of Article Views (full-text article views including HTML views, PDF and ePub downloads, according to the available data) and Abstracts Views on Vision4Press platform.
Data correspond to usage on the plateform after 2015. The current usage metrics is available 48-96 hours after online publication and is updated daily on week days.
Initial download of the metrics may take a while.