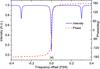
Fig. 5
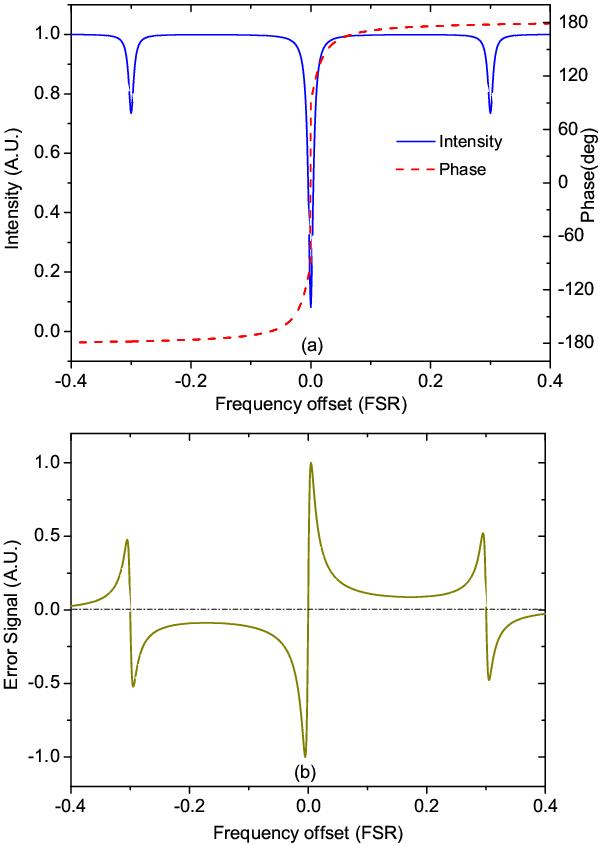
a) Intensity (blue curve) and phase shift (red curve) of a reflected carrier from an optical cavity with ℱ = 200. b) The expected PDH error signal (the sinΩt-term, see text) with sidebands located within 30% of the FSR. Laser is locked to the zero-crossing point of the error signal where the slope is steepest.
Current usage metrics show cumulative count of Article Views (full-text article views including HTML views, PDF and ePub downloads, according to the available data) and Abstracts Views on Vision4Press platform.
Data correspond to usage on the plateform after 2015. The current usage metrics is available 48-96 hours after online publication and is updated daily on week days.
Initial download of the metrics may take a while.