| Issue |
A&A
Volume 569, September 2014
|
|
|---|---|---|
| Article Number | A99 | |
| Number of page(s) | 6 | |
| Section | Stellar atmospheres | |
| DOI | https://doi.org/10.1051/0004-6361/201424051 | |
| Published online | 01 October 2014 | |
Weak metal lines in optical high-resolution Very Large Telescope and Keck spectra of “cool” PG 1159 stars
Institute for Astronomy and Astrophysics, Kepler Center for Astro and
Particle Physics, Eberhard Karls University,
Sand 1,
72076
Tübingen,
Germany
e-mail:
This email address is being protected from spambots. You need JavaScript enabled to view it.
Received: 23 April 2014
Accepted: 1 August 2014
Abstract
PG 1159 stars are very hot (effective temperatures Teff = 75 000–200 000 K), hydrogen-deficient (pre-) white dwarfs. They probably are the result of a late helium-shell flash that laid bare the He, C, and O rich intershell matter of the progenitor Asymptotic Giant Branch (AGB) star. Their chemical surface composition thus allows to conclude on details of AGB-star nucleosynthesis. Due to their very high effective temperatures, detailed spectral analyses are usually completely reliant on ultraviolet observations, except for some species in the hottest PG 1159 stars (Teff ≳ 130 000 K), which do exhibit highly excited lines from the CNO elements and neon (C iv, N v, O vi, Ne vii-viii) in optical spectra. Particularly problematic are, however, the coolest members of the PG 1159 class that exclusively show C iv lines in the optical. Access to the nitrogen abundance is important to decide which of the late-thermal pulse evolutionary scenarios was experienced by a particular star, while a high oxygen abundance is an important marker that the star could pulsate. In the present paper, we investigate high-resolution high signal-to-noise optical spectra of three “cool” PG 1159 stars (PG 0122+200, PG 2131+066, MCT 0130−1937, Teff = 80 000–95 000 K). With the help of non-LTE model atmospheres and synthetic spectra, we are able to identify a large number of weak CNO lines (C iii, N iv, O iii-v) that were not detected before in these stars. They allow abundance determinations and enable us to constrain the effective temperature to high precision through ionization equilibria without the requirement to access the ultraviolet spectral range.
Key words: stars: abundances / stars: atmospheres / stars: evolution / stars: AGB and post-AGB / white dwarfs
© ESO, 2014
1. Introduction
PG 1159 stars are hot hydrogen-deficient post-asymptotic giant branch (post-AGB) stars (Werner & Herwig 2006). In the Hertzsprung-Russell diagram, they cover a region comprising the hottest central stars of planetary nebulae and white dwarfs (Teff = 75 000–200 000 K, log g = 5.5–8). Their H-deficiency is most probably the result of a (very) late He-shell flash (or, thermal pulse). Their envelopes are mainly composed of He, C, and O with rather diverse abundance patterns (He = 0.30–0.92, C = 0.08–0.60, O = 0.02–0.20, mass fractions; Werner & Herwig 2006; Werner et al. 2014). Their optical spectra are dominated by lines from He ii and C iv. Occasionally, lines from N v, O vi, and Ne vii-viii are detectable too. In the past, essentially all investigations that aimed at abundance determinations of metals (except of carbon) utilized ultraviolet (UV) spectra, because almost all mid-Z elements from fluorine up to iron were originally detected (and can only be seen) in the UV. Even N and O abundances for the majority of the investigated PG 1159 stars were determined from UV spectra because optical O vi lines appear only in the hottest objects.
The general interest in quantitative abundance determinations for metals heavier than the CNO elements arises from the their potential as tracers for details in AGB-star nucleosynthesis, because the former helium-rich intershell region was laid bare by the (very) late thermal pulse, (V)LTP. In this paper, we focus on the N and O abundances or, more precisely, on the tools for their determination. We show that high-quality optical spectra with sufficient resolution enable the detection of weak lines from these species, so that abundance determinations can be performed without access to the UV – a necessity that will become fully aware as soon as UV spectroscopy with the Hubble Space Telescope (HST) will not be possible anymore.
The N and O abundances in PG 1159 stars are important to know in the context of the evolutionary history of the stars and asteroseismology. A high nitrogen abundance (of the order of 1%) immediately tells us that the star has experienced a very late thermal pulse, when it already was a white dwarf (WD). Otherwise, the LTP occurred in the post-AGB, pre-WD phase. The O abundance, on the other hand, determines whether a PG 1159 star that is located in the GW Vir instability strip does pulsate or not (e.g. Quirion et al. 2007). A minimum abundance of O is necessary to drive the pulsations that are caused by the joint κ − γ effect of C and O in the stellar envelope.
Another advantage offered by additional CNO lines in the optical range is a more reliable Teff determination. Particularly in those stars for which only lines from He ii and C iv could be utilized, the lack of any ionization balance results in relatively large error estimates. With the detection of additional CNO lines in different ionization stages, this problem can be overcome.
In the following, we report on the new detection of weak CNO lines in high-resolution spectra of three PG 1159 stars (Sect. 2). The line identification and abundance analysis required the development of new, very much enlarged non-local thermodynamic equilibrium (NLTE) model atoms that shall be introduced in Sect. 3. We then compare the CNO abundances derived from the optical spectra with previous results that were mainly based on UV spectroscopy (Sect. 4) and conclude with a short summary in Sect. 5.
2. Observations and line identifications
We investigate the optical high-resolution spectra of three PG 1159 stars. The objects PG 0122+200 and PG 2131+066 were observed with the High Resolution Echelle Spectrometer (HIRES) and the blue cross-disperser at the 10 m Keck I telescope on July 20, 1998 under excellent weather conditions. The spectra cover the range 3610–5125 Å with a resolution of about 0.1 Å. For PG 0122+200 and PG 2131+066, we have taken two and four spectra, respectively, with a total of two hours exposure time for each star, and they were later co-added. The spectrum of PG 2131+066 has a data gap in the 4030–4230 Å range. For details of the data reduction, see Zuckerman & Reid (1998). The object MCT 0130−1937 was observed within the Supernova Ia Progenitor Survey (SPY; Napiwotzki et al. 2001, 2003) with the Ultraviolet and Visual Echelle Spectrograph (UVES) in dichroic mode at the European Southern Observatory (ESO) Very Large Telescope (VLT) on Aug. 22, 2001 and Sep. 12, 2002, covering the wavelength range 3300–6760 Å with a resolution of about 0.2 Å. For details of the data reduction, see Werner et al. (2004). All spectra were rectified before comparison with our models.
All three stars were previously analysed by Dreizler & Heber (1998, henceforth DH98) using medium resolution (between 1 and 3.5 Å) ultraviolet and optical data; their results are summarized in Table 1. Accordingly, all objects have the same surface gravity and slightly different effective temperatures. The object MCT 0130−1937 differs from the others by its significantly lower CNO content.
Programme stars of this work and their parameters.
Low-ionization lines newly identified in at least one of our programme stars.
For the first time in PG 1159 stars, we have identified a large number of lines from C, N, and O at relatively low ionization stages in our optical spectra (C iii, N iv, O iii-v; Table 2) besides the usual lines of higher stages of C iv, N v, and O vi, albeit the lines of the latter two ions are very weak or absent in our programme stars. Line identification was performed by comparison with synthetic spectra, adding credibility to the identification of even very weak lines. It befits to mention that many of the lines we found were also detected by Herbig (1999) in the Keck HIRES spectrum of BD + 28°4211, a hot subdwarf O star (Teff = 82 000 K, log g = 6.2; Napiwotzki 1993) with solar to slightly subsolar element abundances (Latour et al. 2013).
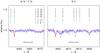 |
Fig. 1 Ionization equilibrium of nitrogen in PG 0122+200. Left: the N iv line at 4058 Å. Also seen is a broad and shallow absorption feature from the C iii triplet at 4068–4070 Å. Right: the N v doublet at 4604/4620 Å. Overplotted is a model with Teff = 80 000 K, log g = 7.5, C/He = 0.1, N/He = 0.01, and O/He = 0.01. Question marks denote unidentified lines. |
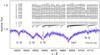 |
Fig. 2 Characteristic PG 1159 star absorption-trough region of PG 0122+200. In addition to the usual C iv 4645–4665 Å lines and He ii λ4686, a broad O iv line at 4632 Å is seen and possibly a N iv line at 4707 Å. Overplotted is a model with Teff = 80 000 K, log g = 7.5, C/He = 0.1, N/He = 0.01, and O/He = 0.01. |
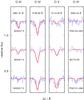 |
Fig. 3 Ionization equilibrium of oxygen. One spectral line of each ionization stage O iii-vi is shown in the panels from left ro right. Each panel displays the observed spectra from our programme stars (top to bottom) and an overplotted model profile. Teff and log g for each star’s model are indicated. All models have the same abundances (C/He = 0.1, O/He = 0.01). Tick marks on the abscissa are spaced by 1 Å. |
2.1. Carbon
The strongest C iii lines are the three multiplet components at 4069 Å. They can be seen in PG 0122+200 as a broad, very shallow trough and not as distinct lines (Fig. 1). This multiplet is absent in MCT 0130−1937 because of the star’s higher temperature, and it falls in the above-mentioned data gap in the spectrum of PG 2131+066. Another detectable C iii line is the strongest component of a multiplet at 4163 Å. It is only visible in PG 0122+200. At the location of the C iii 4647–4651 Å triplet, the broad C iv lines dominate. A close inspection of the spectrum of PG 0122+200 (Fig. 2) shows that the 4650 Å component is a very weak emission line, and possibly, the 4651 Å component as well. The singlet at 5696 Å is only covered by our spectrum of MCT 0130−1937, however, with rather poor signal-to-noise ratio preventing a clear identification. According to our models, it should be visible in better spectra.
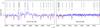 |
Fig. 4 Details from the spectra of two programme stars showing predominantly lines from O iv. Overplotted are model spectra (smooth red lines). Left: MCT 0130−1937 (with model Teff = 90 000 K, log g = 7.5, C/He = 0.1, O/He = 0.01). Right: PG 0122+200 (with model Teff = 80 000 K, log g = 7.5, and the same abundances). |
2.2. Nitrogen
We found four N iv lines; however, two of them are very weak and their identification is uncertain. We clearly see the weak singlet at 3748 Å and a strong singlet at 4058 Å in PG 0122+200 (Fig. 1). They are absent in MCT 0130−1937 because of its much lower N abundance. The 3748 Å line is not visible in PG 2131+066 because of its higher temperature, while, unfortunately, the 4058 Å line is located in the data gap for PG 2131+066. The other two uncertain N iv lines at 4707 Å (Fig. 2) and 4804 Å are the strongest components of a 5f–6g multiplet, which are more pronounced in the model than in the observation of PG 0122+200. As in the above case of the 4f–5g C iii line, linear Stark broadening could be the reason. Our model spectrum predicts another nine N iv lines (the complete  –3P and 3S – multiplets) in the range 3440–3485 Å, which is, however, not covered by our spectra of PG 0122+200 and PG 2131+066 (the 3S – multiplet was detected in the above-mentioned spectrum of BD + 28°4211). Our models predict a number of other N iv lines in the region 3440–3490 Å that is not covered by the spectra of the two N-rich stars discussed here. They stem from the 3455–3475 Å and 3479–3485 Å multiplets.
Both N-rich stars show the 3s–3p doublet of N v at 4604/4620 Å in absorption (for PG 0122+200 see right panel of Fig. 1). In the hotter PG 1159 stars, this doublet is often seen in emission (e.g. Werner & Heber 1991).
2.3. Oxygen
The only detected O iii line is a singlet at 3962 Å. It is visible in all three stars (left panel of Fig. 3). Another O iii line, which is located at 5592 Å, is predicted to be significantly weaker. The majority of the newly detected lines stems from O iv. In Fig. 4, we show some prominent examples. With two notable exceptions, these lines are deep and narrow. One of the significantly broader O iv lines (at 4632 Å) is shown in Fig. 2. We display the C iv/He ii absorption trough region that is the hallmarking feature of PG 1159 stars there. The broad O iv line is a highly excited 5g–6h transition, and, hence, is probably affected by linear Stark effect (see below). The other broad O iv line is the 5f–6g transition at 4344 Å (Fig. 5). Interestingly, the 5d–6f transition at 4389 Å is completely absent in the observed spectra but it is as strong as the two other mentioned 5–6 transitions in the model. Either the excitation energy of one of the involved levels (and therefore the line position) as listed in NIST is wrong, or the OP oscillator strength is much too large. We suspect that the former explanation is true, and several candidates appear in the observed spectra, which are unidentified and have relatively broad features. Two of them can be seen in Fig. 2 at 4606 and 4613 Å.
Three lines from O v were detected. They are relatively weak with the most obvious one located at 5114 Å (Fig. 3). The O vi 3s–3p doublet at 3811/3834 Å, which is seen in emission in the hotter PG 1159 stars, is completely absent in PG 0122+200 and MCT 0130−1937; these stars are too cool. It is seen, though weak, in absorption in the hottest programme star, PG 2131+066 (Fig. 3).
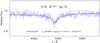 |
Fig. 5 Unusually broad O iv line overplotted with two model profiles differing by the treatment of line broadening. Thin (red) line: usual quadratic Stark broadening; the computed profile is too deep and too narrow. Thick (black) line: Stark damping constant increased by a factor of ten. |
Number of NLTE levels and line transitions of model atoms for the computation of the atmospheric structure.
3. Model atoms and model atmospheres
We computed non-LTE line-blanketed model atmospheres and synthetic spectra with our Tübingen Model Atmosphere Package TMAP1 (Werner et al. 2003; Rauch & Deetjen 2003) that is routinely used for the spectral analysis of hot WDs. Plane-parallel geometry and radiative and hydrostatic equilibrium are assumed. The models consist of He, C, and O with different abundances and a variety of Teff and log g values. To save computing time, we start each model calculation with a reduced number of NLTE levels for C iii and O iii-v. Then the number of NLTE levels in these ions is increased, and their populations are iterated by keeping fixed the atmospheric structure (temperature and pressure stratification). Relative to the main atmospheric constituents, nitrogen is treated as a trace element and therefore not included in the computation of the model atmosphere. The respective NLTE level populations are iterated on the fixed atmospheric structure.
The size of our model atoms (i.e. the number of NLTE levels) is determined by the requirement to model as far as possible all spectral lines observed in our programme stars, even if they occur between highly excited levels. The number of levels and lines of each ion is listed in Table 3. For the final calculation of the synthetic spectra, fine-structure splitting of atomic levels is introduced at which the level population is distributed among sublevels according to their statistical weights.
Since the present paper is focused on the identification of new spectral lines, substantial effort was dedicated to the construction of new extended model atoms, specifically for C iii, N iv, and O iv-v. Consequently, we describe the design and data sources in some detail. To keep the presentation concise, we refer the reader to our Tübingen Model Atom Database TMAD2, which was created in the framework of the German Astrophysical Virtual Observatory (GAVO3) at Tübingen, and from which the atomic data input is publicly available.
Generally, energy levels were retrieved from the National Institute of Standards and Technology (NIST) database4. Levels not listed there were taken from either Bashkin & Stoner (1975) or the Opacity Project5 (OP) database (Seaton et al. 1994). Oscillator strengths were mainly retrieved from OP. In some cases, the databases of NIST, CHIANTI6 (Dere et al. 1997; Landi et al. 2013), and the Kentucky Atomic Line List7 were also used. Whenever possible, OP photoionization cross-sections were used; otherwise, hydrogenic values were assumed. For electron collisional excitation and ionization, we used standard approximation formulae following van Regemorter (1962) and Seaton (1962).
Synthetic spectra were convolved with Gaussians (FWHM = 0.1 Å and 0.2 Å for fits to Keck and VLT spectra, respectively) accounting for the spectral resolution of the observations.
3.1. Carbon
Since the observed lines of C iii involve the 5g and 5f levels in the triplet system (with excitation energies up to 349 000 cm-1), a large model atom with levels up to 386 000 cm-1 was necessary to compute reliable line profiles. Because C iv lines dominate the spectra of PG 1159 stars, levels up to principal quantum number n = 10 (503 000 cm-1) are considered.
For both ions, unavailable f-values (oscillator strengths) for transitions to highest excited states were extrapolated from lower series members. This measure does not refer to f-values of the observed lines.
3.2. Nitrogen
A large N iv model atom (with levels up to 589 000 cm-1) is required because the uppermost levels related to observed lines are the 6g states in the singlet and triplet systems. For the one-valence-electron system N v, all levels up to n = 10 (762 000 cm-1) are considered, although the only observed line pair in our spectra is the low-excitation 3s–3p doublet at 4604/4620 Å.
3.3. Oxygen
For O iii, a moderate model atom with levels up to 381 000 cm-1 was deemed necessary to model the only observed line of this ion. The majority of the oxygen lines in the spectra stem from O iv. There, the highest excited visible lines are n = 5–6 transitions, thus, the model atom is very large and involves levels up to 600 000 cm-1. The 5g–6h multiplet at 4632 Å has no f-values in the sources cited above. We extrapolated these values from those of lower series members of the n = 5–6 sublevel-transitions, which probably are good to within 10%. As mentioned above, the two observed O iv n = 5–6 lines at 4344 and 4632 Å are significantly broader than the other lines of this ion. We suspect that the assumption of quadratic Stark broadening is not justified. With an increasing principal quantum number, the energy difference between sublevels with a different angular quantum number is shrinking, so that linear Stark broadening could become important. As an experiment, we increased the damping constant of the quadratic Stark profile by a factor of ten for the 4344 Å line (Fig. 5), leading to a weaker line core and broader wings such that the observed profile is matched quite well.
Only three O v lines are detectable; however, they involve very highly excited lines, so that the O v model atom became the largest in our study with levels up to 876 000 cm-1. The O vi model atom, on the other hand, is the smallest one, because the only line relevant here is the 3s–3p doublet at 3811/3834 Å.
4. Comparison with results from previous UV analysis
The above-mentioned study of DH98, which included our three programme stars, aimed at the analysis of nine PG 1159 stars to find composition differences between pulsating and non-pulsating objects. One of the prime motivations to obtain HST UV spectroscopy was the determination of the N and O abundances because no respective spectral lines are seen in medium-resolution optical spectra of the cooler PG 1159 stars. We have computed synthetic spectra for our cool objects with model parameters of DH98 (see Table 1) and compare them to our high-resolution optical spectra. In particular, we can check whether the oxygen ionization balance confirms the effective temperature and whether the N and O abundances lead to line strengths that match our observations.
4.1. PG 0122+200
In Fig. 3, we show four oxygen lines of increasing ionization stages (O iii–vi from left to right) for each of our objects (from top to bottom). For PG 0122+200, it can be seen that the relative line strengths of O iii–v are matched as well as the absence of the O vi line because of the low effective temperature (80 000 K). This confirms the previous Teff determination. However, the optical O lines of all ionization stages suggest a significantly lower O abundance than claimed by DH98 (O/He = 0.1). The model shown in Fig. 3 has O/He = 0.01. We do confirm the high N abundance (N/He = 0.01). In Fig. 1 we display the N iv line at 4058 Å (left panel) as well as the N v doublet at 4604/4620 Å (right panel). The C iii and C iv lines fit well only if we reduce the C abundance claimed by DH98 from C/He = 0.3 to 0.1.
4.2. MCT 0130−1937
The good match of the O iii–vi lines (Fig. 3) confirms both the effective temperature (90 000 K) and the O abundance (O/He = 0.01) of DH98. We also confirm the low abundance of nitrogen. The lack of N iv/v lines in the optical spectra implies an upper limit of N/He = 10-3. Of course, a much stricter limit (10-5) was derived from the lack of the N v resonance doublet in the UV. As to the C abundance, the value of C/He = 0.1 is confirmed by the C iv lines and a very weak C iii 4163 Å line. The highly excited C iii lines are also matched very well by the model (e.g. Fig. 1, left panel).
4.3. PG 2131+066
This star is the hottest one among our sample (95 000 ± 5000 K, according to DH98). Within error limits, this is confirmed by the O ionization balance of the optical lines (Fig. 3), which allow us to fix the temperature to within 5000 K. The O iii line is very weak, while, on the other hand, the O vi line can be seen, in contrast to the other stars. It is not present in the 95 000 K model but in a slightly hotter one (100 000 K).
As for PG 0122+200, the fit to the C and O lines is much better when we reduce the abundances of DH98, namely O/He = 0.07 to 0.01 and C/He = 0.3 to 0.1. The high N abundance found by DH98 (N/He = 0.01) is confirmed by the fit to the N v 3s–3p lines. (The strongest N iv line at 4058 Å falls into the data gap.)
5. Summary and conclusions
We have investigated high-resolution optical spectra of three relatively cool PG 1159 stars. We have identified a large number of hitherto undetected lines from the CNO elements. They allow us to constrain the respective abundances and the effective temperature without the necessity to access the UV spectral region. For a quantitative analysis, the design of new, very extended NLTE model atoms was necessary. The results of our analysis were compared to previous results that were mainly based on medium-resolution UV and optical spectra.
In essence, we confirm effective temperatures, gravities, and N abundances derived for our programme stars by DH98. However, we found that the C and O abundances in all three stars are essentially the same, as opposed to DH98, who suggested that PG 0122+200 and PG 2131+066 have higher abundances. Specifically, the C/He and O/He number ratios are reduced from 0.3 to 0.1 and 0.1 to 0.01, respectively, or as expressed in mass fractions, C and O are reduced from 0.39 to 0.22 and 0.17 to 0.03, respectively. Whether this discrepancy is a consequence of our far more detailed model atoms remains to be clarified by a complete re-analysis of the UV data, which is beyond the scope of this paper. Compared to other PG 1159 stars, which have mass fractions of C = 0.08–0.60 and O = 0.02–0.20 (Werner & Herwig 2006; Werner et al. 2014), the C and O abundances of our programme stars are more close to the lower end of these abundance ranges.
The main motivation for the analysis performed by DH98 was to search for systematic differences between the relative abundances of C, N, and O in pulsating and non-pulsating PG 1159 stars because of the presence of non-pulsators in the GW Vir instability strip in the Teff –log g diagram. From the investigation of nine PG 1159 stars (including our three programme stars), they found that the stars form two distinctive groups with a significantly different N abundance, namely the N-rich ones (N/He = 0.01), which are all pulsators, and the N-poor ones (N/He < 10-5), which are all non-pulsators. It was concluded that the high nitrogen abundance is a prerequisite for pulsation driving. From pulsation modeling, however, this idea was refuted by Quirion et al. (2004) and already Cox (2003) speculated that nitrogen is just a marker for different evolutionary histories leading to different He/C/O abundances in the pulsation driving regions. Nitrogen is regarded as a marker for a VLTP as opposed to an LTP (Werner & Herwig 2006).
As mentioned in the Introduction, it is predominantly the high O abundance that is responsible for pulsation driving (e.g. Quirion et al. 2007). Concerning carbon and oxygen, DH98
concluded that the non-pulsators have lower C and O abundances on average and lower O/C ratios but have regarded this as only marginally significant. The objects PG 0122+200 (80 000 K) and PG 2131+066 (95 000 K) are pulsators; MCT 0130−1937 (90 000 K) is a non-pulsator. With our downward revision of the C and O abundances in the two pulsators, the three stars even have identical C and O abundances. Concerning the effective temperature, the non-pulsator is bracketed by the two pulsators, which is surprising because the other atmospheric parameters (including surface gravity) are all identical – except for the N abundance!
Is the determined, low mass fraction of O = 0.03 sufficient at all to drive pulsations? According to the numerical experiments of Quirion et al. (2007), this is still possible for high-gravity (log g ≥ 7.5) objects with Teff near 80 000–120 000 K (their Fig. 15).
Acknowledgments
We thank Ralf Napiwotzki for putting the reduced VLT spectra at our disposal. Keck data were taken in collaborative observations with I. N. Reid. The GAVO project at Tübingen has been supported by the Federal Ministry of Education and Research (BMBF, grants 05AC6VTB, 05AC11VTB). A travel grant from the DFG (WE 1312/21-1) to the Keck observatory is gratefully acknowledged. We thank the referee for thoughtful suggestions that helped to improve the interpretation of our results. T. Rauch is supported by the German Aerospace Center (DLR) under grant 05 OR 1301. This research has made use of the SIMBAD database, operated at CDS, Strasbourg, France.
References
- Bashkin, S., & Stoner, J. O. 1975, Atomic energy levels and Grotrian Diagrams – Vol. 1: Hydrogen I – Phosphorus XV; Vol. 2: Sulfur I – Titanium XXII [Google Scholar]
- Cox, A. N. 2003, ApJ, 585, 975 [NASA ADS] [CrossRef] [Google Scholar]
- Dere, K. P., Landi, E., Mason, H. E., Monsignori Fossi, B. C., & Young, P. R. 1997, A&AS, 125, 149 [NASA ADS] [CrossRef] [EDP Sciences] [Google Scholar]
- Dreizler, S., & Heber, U. 1998, A&A, 334, 618 [NASA ADS] [Google Scholar]
- Herbig, G. H. 1999, PASP, 111, 1144 [NASA ADS] [CrossRef] [Google Scholar]
- Landi, E., Young, P. R., Dere, K. P., Del Zanna, G., & Mason, H. E. 2013, ApJ, 763, 86 [NASA ADS] [CrossRef] [Google Scholar]
- Latour, M., Fontaine, G., Chayer, P., & Brassard, P. 2013, ApJ, 773, 84 [NASA ADS] [CrossRef] [Google Scholar]
- Napiwotzki, R. 1993, Acta Astron., 43, 343 [NASA ADS] [Google Scholar]
- Napiwotzki, R., Christlieb, N., Drechsel, H., et al. 2001, Astron. Nachr., 322, 411 [NASA ADS] [CrossRef] [Google Scholar]
- Napiwotzki, R., Christlieb, N., Drechsel, H., et al. 2003, The Messenger, 112, 25 [NASA ADS] [Google Scholar]
- Quirion, P.-O., Fontaine, G., & Brassard, P. 2004, ApJ, 610, 436 [NASA ADS] [CrossRef] [Google Scholar]
- Quirion, P.-O., Fontaine, G., & Brassard, P. 2007, ApJS, 171, 219 [NASA ADS] [CrossRef] [Google Scholar]
- Rauch, T., & Deetjen, J. L. 2003, in Stellar Atmosphere Modeling, eds. I. Hubeny, D. Mihalas, & K. Werner, ASP Conf. Ser., 288, 103 [Google Scholar]
- Seaton, M. J. 1962, in Atomic and Molecular Processes, ed. D. R. Bates, 375 [Google Scholar]
- Seaton, M. J., Yan, Y., Mihalas, D., & Pradhan, A. K. 1994, MNRAS, 266, 805 [NASA ADS] [CrossRef] [Google Scholar]
- van Regemorter, H. 1962, ApJ, 136, 906 [NASA ADS] [CrossRef] [Google Scholar]
- Werner, K., & Heber, U. 1991, A&A, 247, 476 [NASA ADS] [Google Scholar]
- Werner, K., & Herwig, F. 2006, PASP, 118, 183 [NASA ADS] [CrossRef] [Google Scholar]
- Werner, K., Heber, U., & Hunger, K. 1991, A&A, 244, 437 [NASA ADS] [Google Scholar]
- Werner, K., Deetjen, J. L., Dreizler, S., et al. 2003, in Stellar Atmosphere Modeling, eds. I. Hubeny, D. Mihalas, & K. Werner, ASP Conf. Ser., 288, 31 [Google Scholar]
- Werner, K., Rauch, T., Reiff, E., Kruk, J. W., & Napiwotzki, R. 2004, A&A, 427, 685 [NASA ADS] [CrossRef] [EDP Sciences] [Google Scholar]
- Werner, K., Rauch, T., & Kepler, S. O. 2014, A&A, 564, A53 [NASA ADS] [CrossRef] [EDP Sciences] [Google Scholar]
- Zuckerman, B., & Reid, I. N. 1998, ApJ, 505, L143 [NASA ADS] [CrossRef] [Google Scholar]
All Tables
Number of NLTE levels and line transitions of model atoms for the computation of the atmospheric structure.
All Figures
|
Fig. 1 Ionization equilibrium of nitrogen in PG 0122+200. Left: the N iv line at 4058 Å. Also seen is a broad and shallow absorption feature from the C iii triplet at 4068–4070 Å. Right: the N v doublet at 4604/4620 Å. Overplotted is a model with Teff = 80 000 K, log g = 7.5, C/He = 0.1, N/He = 0.01, and O/He = 0.01. Question marks denote unidentified lines. |
| In the text | |
|
Fig. 2 Characteristic PG 1159 star absorption-trough region of PG 0122+200. In addition to the usual C iv 4645–4665 Å lines and He ii λ4686, a broad O iv line at 4632 Å is seen and possibly a N iv line at 4707 Å. Overplotted is a model with Teff = 80 000 K, log g = 7.5, C/He = 0.1, N/He = 0.01, and O/He = 0.01. |
| In the text | |
|
Fig. 3 Ionization equilibrium of oxygen. One spectral line of each ionization stage O iii-vi is shown in the panels from left ro right. Each panel displays the observed spectra from our programme stars (top to bottom) and an overplotted model profile. Teff and log g for each star’s model are indicated. All models have the same abundances (C/He = 0.1, O/He = 0.01). Tick marks on the abscissa are spaced by 1 Å. |
| In the text | |
|
Fig. 4 Details from the spectra of two programme stars showing predominantly lines from O iv. Overplotted are model spectra (smooth red lines). Left: MCT 0130−1937 (with model Teff = 90 000 K, log g = 7.5, C/He = 0.1, O/He = 0.01). Right: PG 0122+200 (with model Teff = 80 000 K, log g = 7.5, and the same abundances). |
| In the text | |
|
Fig. 5 Unusually broad O iv line overplotted with two model profiles differing by the treatment of line broadening. Thin (red) line: usual quadratic Stark broadening; the computed profile is too deep and too narrow. Thick (black) line: Stark damping constant increased by a factor of ten. |
| In the text | |
Current usage metrics show cumulative count of Article Views (full-text article views including HTML views, PDF and ePub downloads, according to the available data) and Abstracts Views on Vision4Press platform.
Data correspond to usage on the plateform after 2015. The current usage metrics is available 48-96 hours after online publication and is updated daily on week days.
Initial download of the metrics may take a while.