Fig. 9
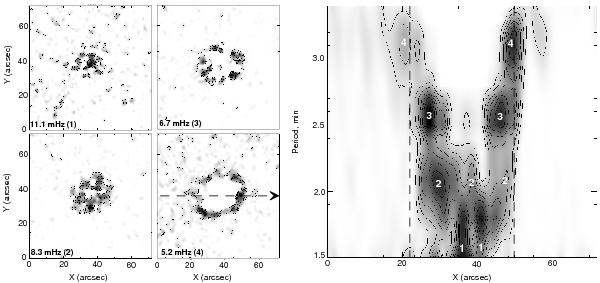
a) Running-difference narrowband maps of the umbral oscillations signals obtained at 304 Å, integrated from 02:30 to 03:30 UT, at the frequencies 11.11 mHz (1.5 min), 8.3 mHz (2.0 min), 6.7 mHz (2.5 mHz), and 5.2 mHz (3.2 min). b) Dependence of the narrowband power distribution across the umbra (in the horizontal direction via the sunspot centre, see the dashed arrow in the 5.2 mHz map in panel a)) on the oscillation period. The vertical dashed lines show the umbral boundaries. The digits indicate the spectral power enhancements that coincide with the spectral peaks in Fig. 2b.
Current usage metrics show cumulative count of Article Views (full-text article views including HTML views, PDF and ePub downloads, according to the available data) and Abstracts Views on Vision4Press platform.
Data correspond to usage on the plateform after 2015. The current usage metrics is available 48-96 hours after online publication and is updated daily on week days.
Initial download of the metrics may take a while.