Fig. 6
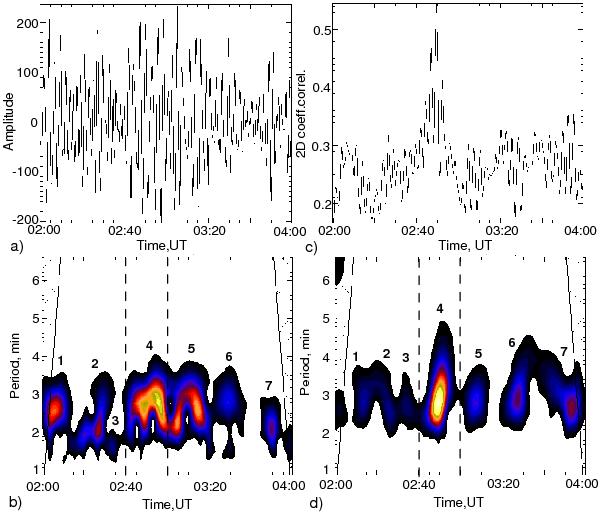
Time evolution of the 3 min oscillation amplitude a), and the 2D cross-correlation coefficients c) during two hours (02:00–04:00 UT) at 304 Å. The distribution of the spectral power of these quantities in the narrowband is shown in panels b) and d), respectively. Time instants of the enhanced oscillation power are enumerated.
Current usage metrics show cumulative count of Article Views (full-text article views including HTML views, PDF and ePub downloads, according to the available data) and Abstracts Views on Vision4Press platform.
Data correspond to usage on the plateform after 2015. The current usage metrics is available 48-96 hours after online publication and is updated daily on week days.
Initial download of the metrics may take a while.