Fig. 5
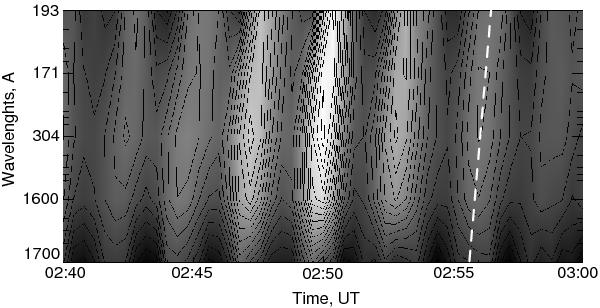
2D cross-correlation function calculated for one train of 3 min oscillations, observed at different wavelengths. The base signal is the image taken at 02:49 UT at 304 Å when the spiral wave front was most pronounced. The value of the cross-correlation function is shown by the brightness. The time lag in the formation of the spiral wave front is highlighted by the dashed line. The wavelengths of different observational channels are shown in Å.
Current usage metrics show cumulative count of Article Views (full-text article views including HTML views, PDF and ePub downloads, according to the available data) and Abstracts Views on Vision4Press platform.
Data correspond to usage on the plateform after 2015. The current usage metrics is available 48-96 hours after online publication and is updated daily on week days.
Initial download of the metrics may take a while.