Fig. 3
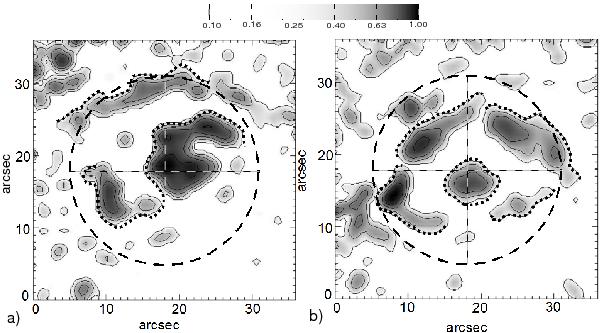
Snapshots of spatial distribution of 3 min oscillation power measured in 304 Å in the umbra of sunspot NOAA 11131, a) at the time instant of the maximum 3 min oscillation power, 02:49 UT; and b) at the minimum power, 02:35 UT, showing the shape of wave fronts. The dashed curve indicates the umbral boundary. The signal is shown in the logarithmic scale. The black dotted curves highlight the apparent wave fronts. The bar shows the normalised logarithmic power, black indicates the high power, and white the lower power.
Current usage metrics show cumulative count of Article Views (full-text article views including HTML views, PDF and ePub downloads, according to the available data) and Abstracts Views on Vision4Press platform.
Data correspond to usage on the plateform after 2015. The current usage metrics is available 48-96 hours after online publication and is updated daily on week days.
Initial download of the metrics may take a while.