Fig. 2
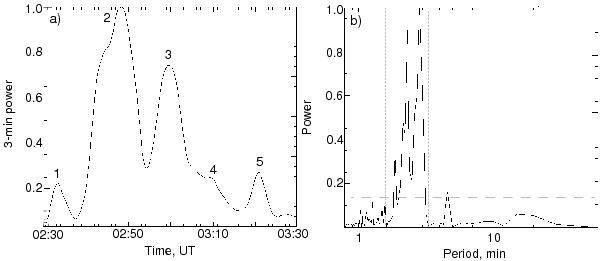
a) Time variation of 3 min oscillation power integrated in the range of periods from 1.5 min to 3.5 min in the sunspot umbra. The signal is measured in the 304 Å emission intensity. The digits label the time intervals of the enhanced power (see also Fig. 1b). b) Fourier power spectrum of oscillations of the 304 Å emission intensity integrated over the umbra. The 3 min power and spectral power density are given in arbitrary units normalised to the highest values.
Current usage metrics show cumulative count of Article Views (full-text article views including HTML views, PDF and ePub downloads, according to the available data) and Abstracts Views on Vision4Press platform.
Data correspond to usage on the plateform after 2015. The current usage metrics is available 48-96 hours after online publication and is updated daily on week days.
Initial download of the metrics may take a while.