Fig. 1
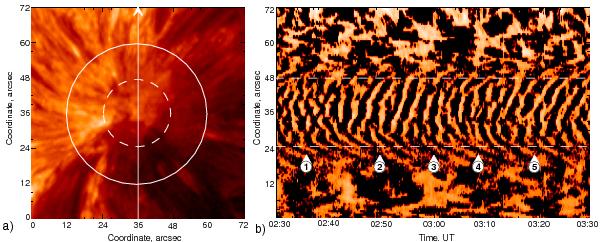
a) SDO/AIA 304 Å image of sunspot NOAA 11131 on 08 December 2010 at 02:00 UT. The dashed line shows the umbra’s outer boundary, the solid line shows the outer boundary of the penumbra. The vertical line shows the slit of the time-distance plot. b) The time-distance plot constructed for the time interval 02:30–03:30 UT in the south-north direction through the sunspot centre. The intensity is given in the logarithmic scale. The horizontal dashed lines show the umbral boundaries. The white triangles labelled with digits show the instants of time when the 3 min oscillation power reaches the local maxima.
Current usage metrics show cumulative count of Article Views (full-text article views including HTML views, PDF and ePub downloads, according to the available data) and Abstracts Views on Vision4Press platform.
Data correspond to usage on the plateform after 2015. The current usage metrics is available 48-96 hours after online publication and is updated daily on week days.
Initial download of the metrics may take a while.