Fig. B.1
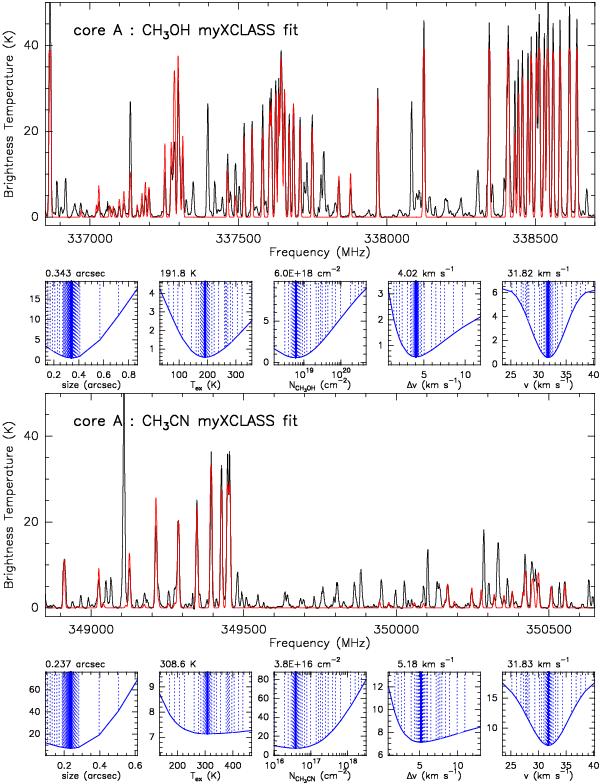
Large panels: observed CH3OH (top panel) and
CH3CN
(bottom panel) lines toward core A in G35.20−0.74 N. The red line shows the best
fitted obtained by myXCLASS (see Sect. 4.1).
The fit in the top panel includes ground state CH3OH and 13CH3OH and torsionally
excited CH3OH lines, while the fit in the bottom panel
includes ground state CH3CN and CH CN and vibrationally excited
CH3CN
lines in the frequency ranges shown in the panels. Small panels: χ2
values obtained from the fits minimization. From left to right
the panels show the size, the temperature, the column density, the
linewidth and the LSR velocity.
CN and vibrationally excited
CH3CN
lines in the frequency ranges shown in the panels. Small panels: χ2
values obtained from the fits minimization. From left to right
the panels show the size, the temperature, the column density, the
linewidth and the LSR velocity.
Current usage metrics show cumulative count of Article Views (full-text article views including HTML views, PDF and ePub downloads, according to the available data) and Abstracts Views on Vision4Press platform.
Data correspond to usage on the plateform after 2015. The current usage metrics is available 48-96 hours after online publication and is updated daily on week days.
Initial download of the metrics may take a while.