Fig. 1
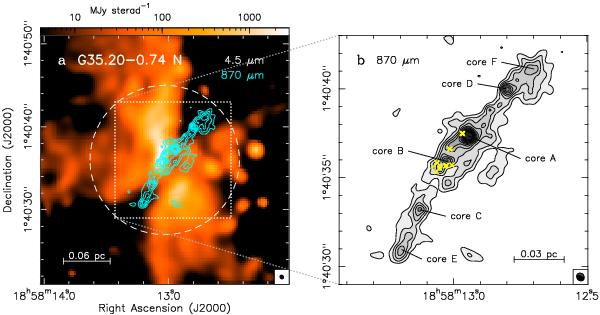
a)Spitzer 4.5 μm image (in
logarithmic scale) of the star forming region G35.20−0.74 N, overlaid with a contour map of
the 870 μm (350 GHz) continuum emission obtained with ALMA.
The IR image has been obtained by applying HiRes deconvolution (Velusamy et al. 2008) to the Spitzer/IRAC data.
The submillimeter map has been corrected for primary beam attenuation. Contours start
at 5σ,
increasing in steps of 6σ (with σ = 1.8 mJy
beam-1), up
to a maximum level of 201.7 mJy beam-1. The dashed white circle denotes the primary beam
of the ALMA 12 m antennas (~9′′), while the ALMA synthesized beam
( , PA = 46°) is shown in the bottom-right corner
of the panel. b) Close-up of the central region that shows the 870
μm
continuum emission map obtained with ALMA. Six cores (from A to F) have been
identified and marked in the image (see Table 2). Yellow crosses mark the position of OH masers (Hutawarakorn & Cohen 1999). The ALMA synthesized beam is shown
in the bottom-right corner of the panel. The spatial scale is also indicated in both
panels.
, PA = 46°) is shown in the bottom-right corner
of the panel. b) Close-up of the central region that shows the 870
μm
continuum emission map obtained with ALMA. Six cores (from A to F) have been
identified and marked in the image (see Table 2). Yellow crosses mark the position of OH masers (Hutawarakorn & Cohen 1999). The ALMA synthesized beam is shown
in the bottom-right corner of the panel. The spatial scale is also indicated in both
panels.
Current usage metrics show cumulative count of Article Views (full-text article views including HTML views, PDF and ePub downloads, according to the available data) and Abstracts Views on Vision4Press platform.
Data correspond to usage on the plateform after 2015. The current usage metrics is available 48-96 hours after online publication and is updated daily on week days.
Initial download of the metrics may take a while.