Fig. 7
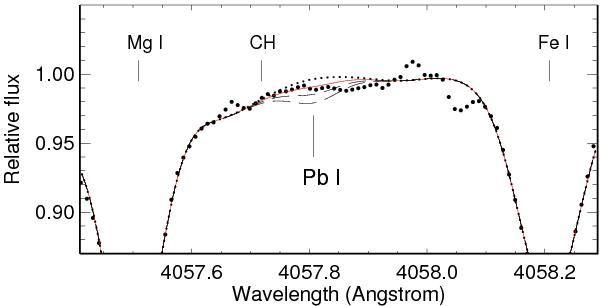
S/N ≃ 80 spectrum of HE 2252−4225 (bold dots) in the region, where the Pb i 4057 Å line is located. The synthetic spectra were computed with no Pb in the atmosphere (dotted curve), log εPb = − 0.78 (continuous curve), −0.48, and −0.28 (dashed curves for both values).
Current usage metrics show cumulative count of Article Views (full-text article views including HTML views, PDF and ePub downloads, according to the available data) and Abstracts Views on Vision4Press platform.
Data correspond to usage on the plateform after 2015. The current usage metrics is available 48-96 hours after online publication and is updated daily on week days.
Initial download of the metrics may take a while.