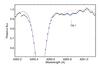
Fig. 5
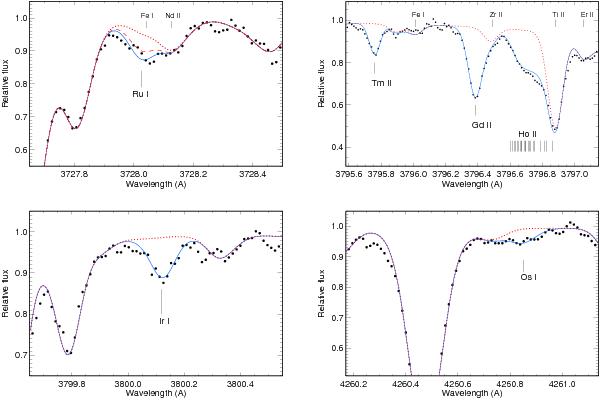
Best fits (continuous curve) of the spectral ranges 3727.7−3728.5 Å and 3795.6−3797.1 Å (top row), where the investigated Ru i, Tm ii, Gd ii, and Ho ii lines are located; Ir i 3800 Å and Os i 4260 Å (bottom row) in the observed spectrum of HE 2252−4225 (bold dots). The dotted curves show the synthetic spectrum with no relevant element in the atmosphere. The dashed curve in the top left panel shows the effect of a 0.2 dex lower Ru abundance on the synthetic spectrum.
Current usage metrics show cumulative count of Article Views (full-text article views including HTML views, PDF and ePub downloads, according to the available data) and Abstracts Views on Vision4Press platform.
Data correspond to usage on the plateform after 2015. The current usage metrics is available 48-96 hours after online publication and is updated daily on week days.
Initial download of the metrics may take a while.