Fig. 2
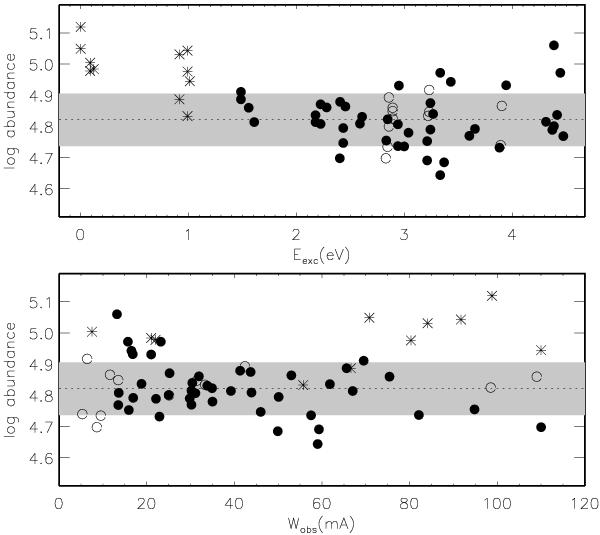
Trends of NLTE abundances with excitation potential and equivalent width, as determined from individual Fe i (filled circles for Eexc≥ 1.2 eV and asterisks for Eexc < 1.2 eV) and Fe ii (open circles) lines, using our adopted stellar parameters. The dotted line indicates the mean Fe abundance from two ionisation stages and the shaded grey area its statistical error.
Current usage metrics show cumulative count of Article Views (full-text article views including HTML views, PDF and ePub downloads, according to the available data) and Abstracts Views on Vision4Press platform.
Data correspond to usage on the plateform after 2015. The current usage metrics is available 48-96 hours after online publication and is updated daily on week days.
Initial download of the metrics may take a while.