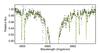
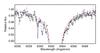
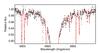
Fig. 1

Top panel: observed profiles of Hβ in HE 2252−4225 (bold dots) and HD 122563 (continuous curve). Middle and bottom panels: synthetic NLTE (continuous curve) and LTE (dashed curve) flux profile of Hα and Hβ computed for Teff = 4710 K compared to the observed spectrum of HE 2252−4225 (bold dots). In all calculations, log g = 1.65, [ Fe /H ] = −2.66, and ξ = 1.7 km s-1.
Current usage metrics show cumulative count of Article Views (full-text article views including HTML views, PDF and ePub downloads, according to the available data) and Abstracts Views on Vision4Press platform.
Data correspond to usage on the plateform after 2015. The current usage metrics is available 48-96 hours after online publication and is updated daily on week days.
Initial download of the metrics may take a while.