Free Access
Fig. 4
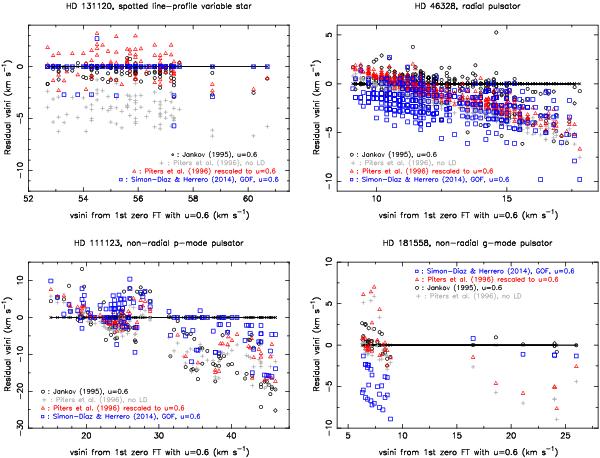
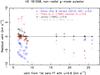
Comparison between the vsini derived from the FT method with u = 0.6 (full line) and from the FBT and GOF methods as indicated. Colour figure available in the online version of the paper.
This figure is made of several images, please see below:
Current usage metrics show cumulative count of Article Views (full-text article views including HTML views, PDF and ePub downloads, according to the available data) and Abstracts Views on Vision4Press platform.
Data correspond to usage on the plateform after 2015. The current usage metrics is available 48-96 hours after online publication and is updated daily on week days.
Initial download of the metrics may take a while.