Free Access
Fig. 9
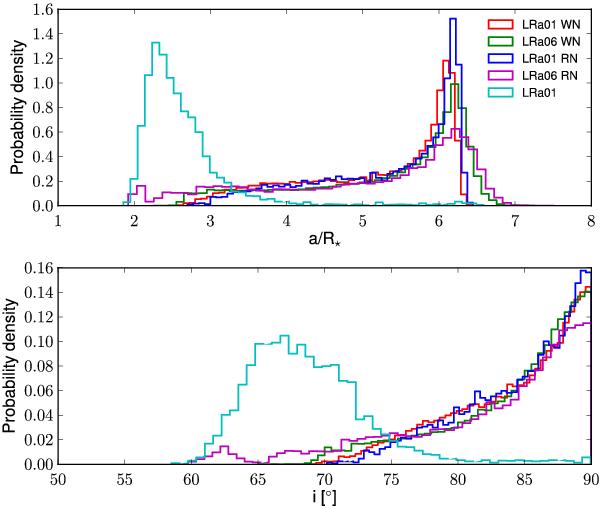
Posterior distribution of a/R∗ (top) and i (bottom) for pure geometric fits of the simulated transit model plus white noise (WN) at phase 0, and the transit model plus real data at phase 0.6 (RN) for both LRa01 and LRa06. For comparison we also show the results for the observations of LRa01.
Current usage metrics show cumulative count of Article Views (full-text article views including HTML views, PDF and ePub downloads, according to the available data) and Abstracts Views on Vision4Press platform.
Data correspond to usage on the plateform after 2015. The current usage metrics is available 48-96 hours after online publication and is updated daily on week days.
Initial download of the metrics may take a while.