Fig. 8
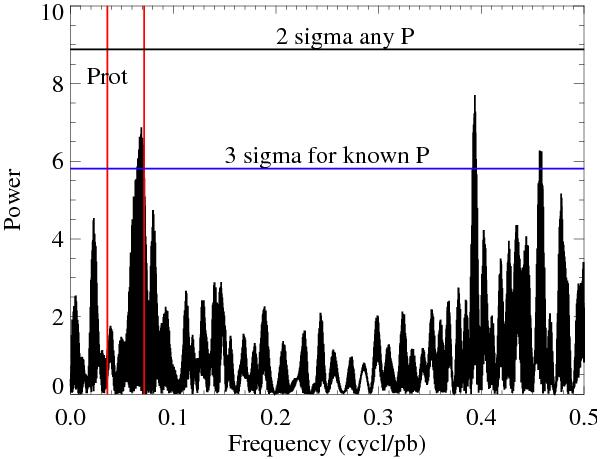
Lomb scargle periodogram of the derived TTVs of CoRoT-7b. The rotation period of the star and half of the rotation period of the star are shown as vertical red lines. We over lay the 2σ false alarm probability level for any period (black horizontal line) and the 3σ false alarm probability level for a known period (blue horizontal line).
Current usage metrics show cumulative count of Article Views (full-text article views including HTML views, PDF and ePub downloads, according to the available data) and Abstracts Views on Vision4Press platform.
Data correspond to usage on the plateform after 2015. The current usage metrics is available 48-96 hours after online publication and is updated daily on week days.
Initial download of the metrics may take a while.