Fig. 11
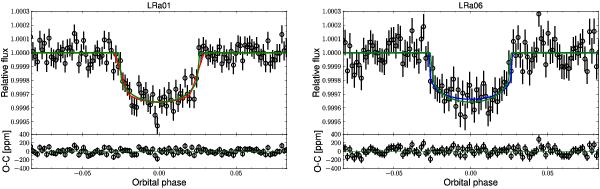
Phase folded light curve of CoRoT-7b binned for clarity. In green we show the best transit model derived from fitting simultaneously the CoRoT light curves and HARPS RVs that corresponds to the circular solution given in Table 2. We also show the best pure geometric transit model for LRa01 (red) and LRa06 (blue) corresponding to the solutions presented in Fig. 5 and Table 1.
Current usage metrics show cumulative count of Article Views (full-text article views including HTML views, PDF and ePub downloads, according to the available data) and Abstracts Views on Vision4Press platform.
Data correspond to usage on the plateform after 2015. The current usage metrics is available 48-96 hours after online publication and is updated daily on week days.
Initial download of the metrics may take a while.