Free Access
Fig. 10
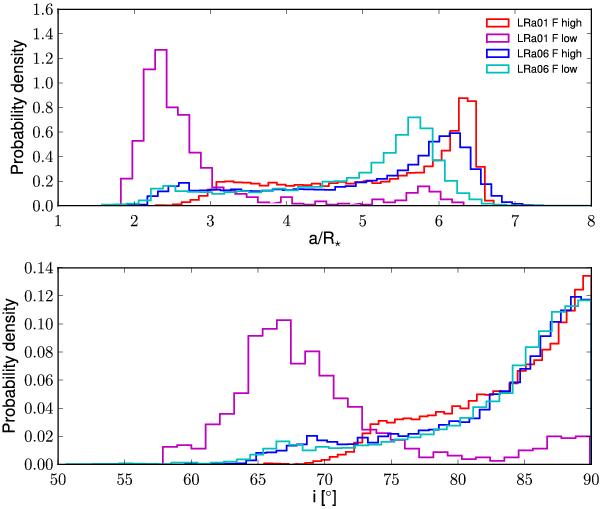
Posterior distribution of a/R∗ (top) and i (bottom) for pure geometric fits of the transit selections based on the out of transit flux. The transits at high flux levels are shown in red for LRa01 and blue for LRa06 while the one at the low flux levels are shown in magenta for LRa01 and cyan for LRa06.
Current usage metrics show cumulative count of Article Views (full-text article views including HTML views, PDF and ePub downloads, according to the available data) and Abstracts Views on Vision4Press platform.
Data correspond to usage on the plateform after 2015. The current usage metrics is available 48-96 hours after online publication and is updated daily on week days.
Initial download of the metrics may take a while.