Free Access
Fig. 1
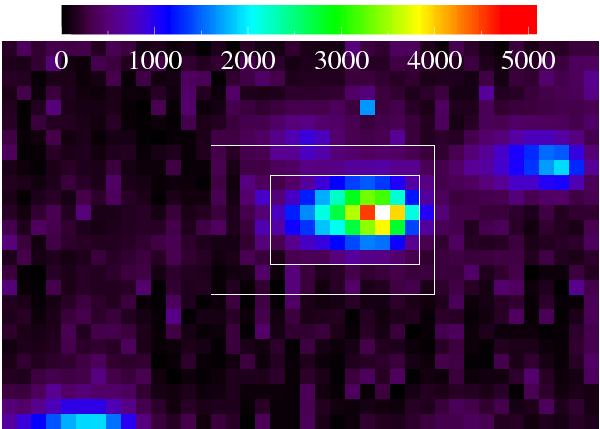
Field of the CoRoT CCD around CoRoT-7. The bigger rectangle shows the imagette position while the smaller rectangle is the optimum aperture used to obtain the final light curve. The images are shown in a square root scale of the flux so that the contaminant in the top left of CoRoT-7 becomes visible.
Current usage metrics show cumulative count of Article Views (full-text article views including HTML views, PDF and ePub downloads, according to the available data) and Abstracts Views on Vision4Press platform.
Data correspond to usage on the plateform after 2015. The current usage metrics is available 48-96 hours after online publication and is updated daily on week days.
Initial download of the metrics may take a while.