Fig. 7
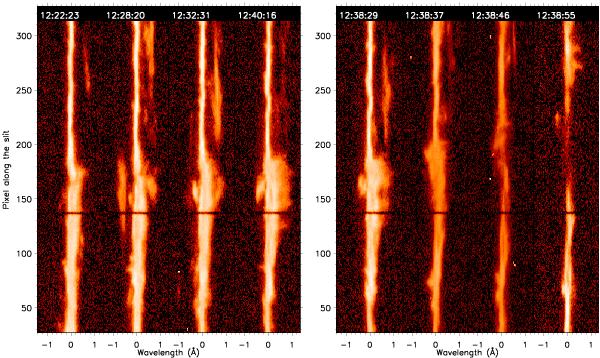
Examples of Mg II k line spectra: evolution of the Mg II 2796.4 Å spectra at 12:22, 12:28, 12:32, 12:40 UT in slit 1 (left). Examples of 2796.4 Å spectra in the four slits of IRIS located from east to west in the slit jaws (slit 1 at 12:38:29, slit 2 at 12:38:37 UT, slit 3 at 12:38:46 UT, slit 4 at 12:38:55 UT) (right). The spectra are between pixel 8 and pixel 314 along the slit. The wavelength range of the Mg II spectra is 2795.00–2797.78 Å and the length of the slit is 47′′. The dark line at pixel = 136 is an instrumental feature used for the alignment of the different lines in the spectra. The zero is taken as the velocity reference. North is up. A movie of the Mg II k spectra is available, see Fig. 14.
Current usage metrics show cumulative count of Article Views (full-text article views including HTML views, PDF and ePub downloads, according to the available data) and Abstracts Views on Vision4Press platform.
Data correspond to usage on the plateform after 2015. The current usage metrics is available 48-96 hours after online publication and is updated daily on week days.
Initial download of the metrics may take a while.