Fig. 4
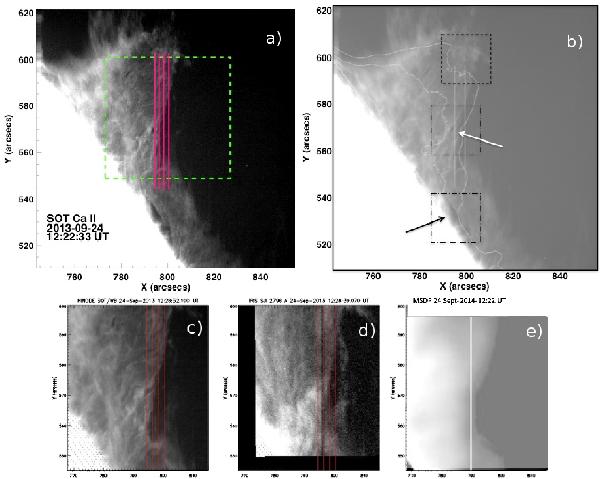
a) Hinode/SOT Ca II at 12:22 UT with a box representing the field of view of IRIS slit jaw and four vertical red lines, the four IRIS slits, and b) the same Ca II image overlaid with the contours of the Hα intensity of MSDP and three small boxes: the top box indicates a turbulent region, the middle box with the white arrow a small dark bubble, the bottom box with the black arrow a large limb bubble. A movie of Hinode/SOT Ca II shows the temporal evolution of the image b); the boxes drawn in b) help to follow the different dynamics observed in the prominence. Bottom panels: images obtained with three different instruments in the IRIS field of view c) in Ca II (SOT), d) in Mg II (IRIS slit jaw), and e) in Hα (MSDP).
Current usage metrics show cumulative count of Article Views (full-text article views including HTML views, PDF and ePub downloads, according to the available data) and Abstracts Views on Vision4Press platform.
Data correspond to usage on the plateform after 2015. The current usage metrics is available 48-96 hours after online publication and is updated daily on week days.
Initial download of the metrics may take a while.