Fig. 3
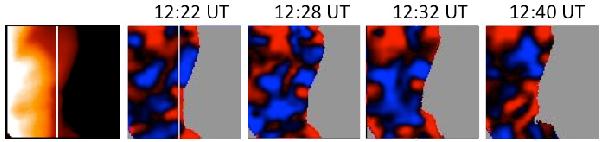
Hα intensity image (left) and four Doppler shift images obtained in Hα ± 0.3 Å (MSDP) (right) in the FOV of IRIS. The Mg II h spectra at the same times are presented in the left panels of Fig. 7. Black/white (blue/red in the online edition) are the blueshifts/redshifts limited to ±2 km s-1. The white vertical line approximately represents the location of the IRIS slit 1 used in Fig. 6.
Current usage metrics show cumulative count of Article Views (full-text article views including HTML views, PDF and ePub downloads, according to the available data) and Abstracts Views on Vision4Press platform.
Data correspond to usage on the plateform after 2015. The current usage metrics is available 48-96 hours after online publication and is updated daily on week days.
Initial download of the metrics may take a while.