Fig. 10
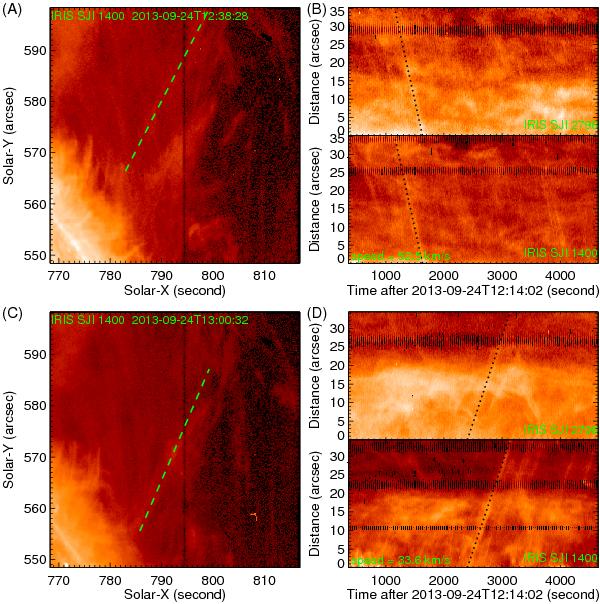
Left panels: A) and C) Si IV slit jaws (47′′ × 47′′) respectively at 12:38:28 UT and 13:00:32 UT showing the cuts of the time slice when the flows are crossing the IRIS slits. Right panels: time slice diagrams are presented in pairs corresponding to MgII and Si IV slit jaws for each cut. B) corresponds to the cut in A), D) to the cut in C). The time slice diagrams show parallel straight lines indicating flows going towards the southeast/northwest direction with a projected speed respectively of 52.5 and 33.6 km s-1. (A Si IV slit-jaw movie is available in the online edition, see also Fig. 14.)
Current usage metrics show cumulative count of Article Views (full-text article views including HTML views, PDF and ePub downloads, according to the available data) and Abstracts Views on Vision4Press platform.
Data correspond to usage on the plateform after 2015. The current usage metrics is available 48-96 hours after online publication and is updated daily on week days.
Initial download of the metrics may take a while.