Fig. 8
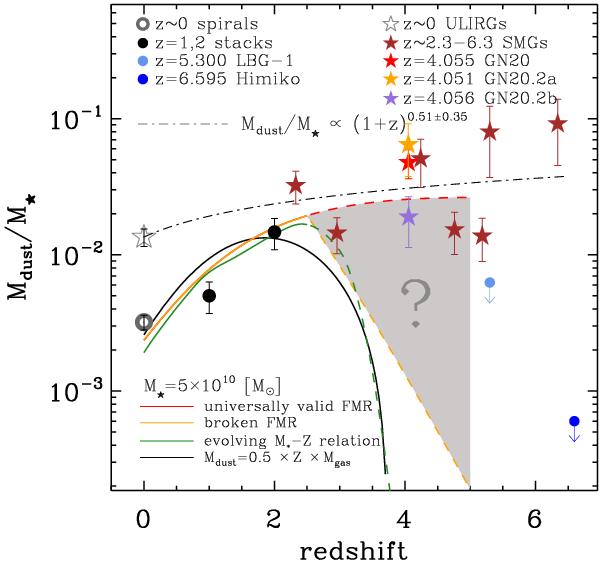
Evolution of Mdust/M⋆ as a function of redshift. The gray circle represents the averaged value of local normal galaxies from the sample of da Cunha et al. (2010a), while black solid circles represent the stacking results at z ~1 and z ~2. The light blue and blue solid circles represent “LBG-1” and “Himiko”, which are star-forming galaxies at z = 5.300 and z = 6.595, respectively. The black solid line shows the expected evolution of Mdust/M⋆ with redshift based on the relation observed in the local universe, Mdust ~ 0.5 × Mgas × Z. Predictions for the redshift-evolution of Mdust/M⋆ of MS galaxies are shown for the case of an universally valid FMR/broken FMR/evolving M⋆ − Z relation at z ≥ 3 (red/orange/green lines; the z> 2.5 extrapolations shown in colored dashed lines are observationally-unconstrained). The shaded region shows the range of Mdust/M⋆ ratio beyond z = 2.5 predicted by our models. All measurements for normal galaxies and predictions have been normalized to a common mass scale of M⋆ = 5 × 10¹⁰ M⊙. The star symbols indicate starbursts, same as in Fig. 7. The black dot-dashed line is the best fit to the starbursts with a relation of Mdust/M⋆ ∝ (1 + z)0.51 ± 0.35.
Current usage metrics show cumulative count of Article Views (full-text article views including HTML views, PDF and ePub downloads, according to the available data) and Abstracts Views on Vision4Press platform.
Data correspond to usage on the plateform after 2015. The current usage metrics is available 48-96 hours after online publication and is updated daily on week days.
Initial download of the metrics may take a while.