Fig. 7
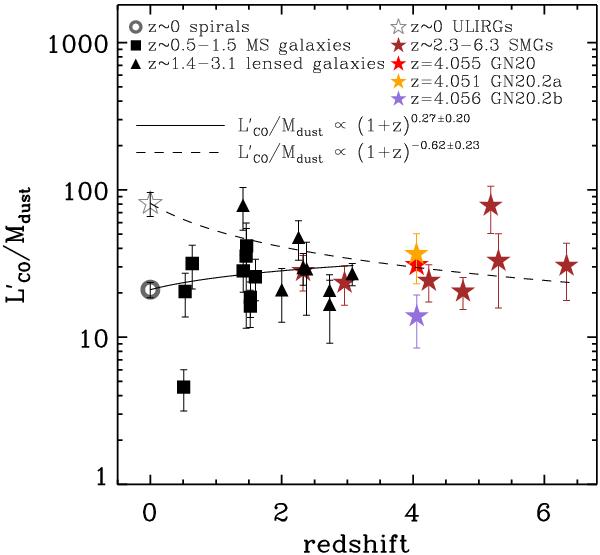
Redshift evolution of  for MS
galaxies and starbursts. At z ~ 0 we use the average value derived from
the samples of Leroy et al. (2011) for the
spirals (gray circle). Black squares represent individually detected normal
star-forming galaxies at z ~ 0.5–1.5 (Daddi et al. 2010; Magdis et al.
2012a), while the black triangles denote lensed galaxies at z ~ 1.4–3.1 (Saintonge et al. 2013). The best fit to the
normal galaxies yields a relation of
for MS
galaxies and starbursts. At z ~ 0 we use the average value derived from
the samples of Leroy et al. (2011) for the
spirals (gray circle). Black squares represent individually detected normal
star-forming galaxies at z ~ 0.5–1.5 (Daddi et al. 2010; Magdis et al.
2012a), while the black triangles denote lensed galaxies at z ~ 1.4–3.1 (Saintonge et al. 2013). The best fit to the
normal galaxies yields a relation of  (solid line). In addition to GN20, GN20.2a, and GN20.2b in our sample at
z =
4.05, we also plot starbursts (grey and color stars) from the
literature as follows: z
~ 0 ULIRGs (Downes &
Solomon 1998); SMM J2135-0102 at z = 2.325 (Swinbank et al. 2010); HSLW-01 at z = 2.957 (Riechers et al. 2011); ID 141 at z = 4.243 (Cox et al. 2011); LESS J033229.4-275619 at
z =
4.760 (Coppin et al. 2010;
Gilli et al. 2014); HDF 850.1 at
z =
5.183 (Walter et al.
2012); AzTEC-3 at z = 5.298 (Capak et al. 2011; Riechers et al.
2010a; Dwek et al. 2011); HFLS3 at
z =
6.34 (Riechers et al.
2013). The best fit to the starburst galaxies gives a relation of
(solid line). In addition to GN20, GN20.2a, and GN20.2b in our sample at
z =
4.05, we also plot starbursts (grey and color stars) from the
literature as follows: z
~ 0 ULIRGs (Downes &
Solomon 1998); SMM J2135-0102 at z = 2.325 (Swinbank et al. 2010); HSLW-01 at z = 2.957 (Riechers et al. 2011); ID 141 at z = 4.243 (Cox et al. 2011); LESS J033229.4-275619 at
z =
4.760 (Coppin et al. 2010;
Gilli et al. 2014); HDF 850.1 at
z =
5.183 (Walter et al.
2012); AzTEC-3 at z = 5.298 (Capak et al. 2011; Riechers et al.
2010a; Dwek et al. 2011); HFLS3 at
z =
6.34 (Riechers et al.
2013). The best fit to the starburst galaxies gives a relation of
 (dashed line).
Current usage metrics show cumulative count of Article Views (full-text article views including HTML views, PDF and ePub downloads, according to the available data) and Abstracts Views on Vision4Press platform.
Data correspond to usage on the plateform after 2015. The current usage metrics is available 48-96 hours after online publication and is updated daily on week days.
Initial download of the metrics may take a while.