Fig. 4
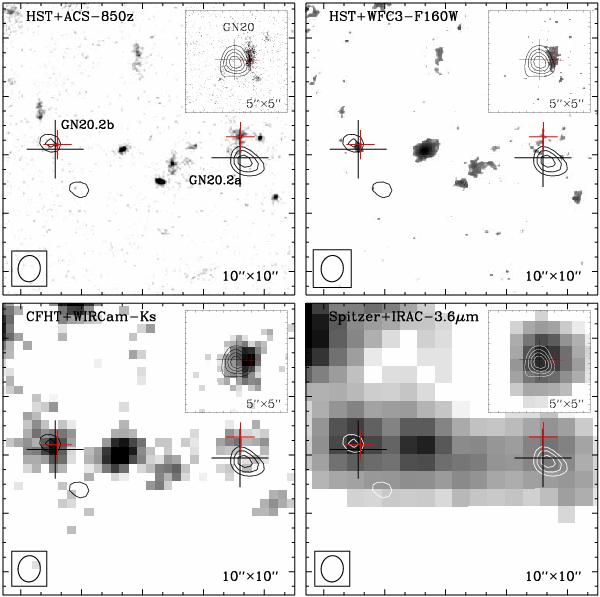
PdBI CO(6–5)+continuum contours (Carilli et al. 2010) at resolution of 0.90′′ × 0.76′′ for GN20 (inset), GN20.2a and GN20.2b overlaid on the ACS 850z-band (top left), WFC3 F160W-band (top right), WIRCam Ks-band (bottom left), and IRAC 3.6 μm (bottom right) images. GN20 lies about 24′′ to the northeast of GN20.2a. Black and red crosses show the positions of the 1.4 GHz counterparts (Owen et al., in prep.) and optical counterparts of GN20, GN20.2a and GN20.2b, respectively. Contour levels are shown in steps of 1σ for GN20.2a and GN20.2b and 3σ for GN20 starting at ±3σ. The beam sizes of CO(6–5) are displayed in the left corner of each map.
Current usage metrics show cumulative count of Article Views (full-text article views including HTML views, PDF and ePub downloads, according to the available data) and Abstracts Views on Vision4Press platform.
Data correspond to usage on the plateform after 2015. The current usage metrics is available 48-96 hours after online publication and is updated daily on week days.
Initial download of the metrics may take a while.