Fig. 2
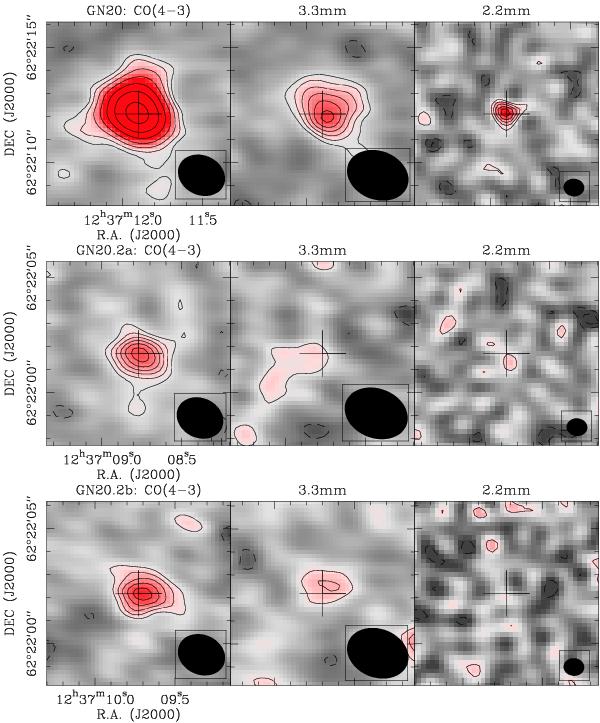
PdBI maps (from left to right) of CO(4–3) line, 3.3 mm, and 2.2 mm continuum emission for GN20 (top), GN20.2a (middle), and GN20.2b (bottom). The CO(4–3) images are averaged over the observed velocity range of CO emission (see Fig. 1) and were cleaned. The 2.2 mm and 3.3 mm continuum maps were created by averaging over the line-free emission channels and were not cleaned given the relatively low S/N. The crosses show the positions where we extract CO spectra. For GN20, the contours level of CO(4–3) are shown increase by a factor of 1.5 starting at ±2σ, with positive (negative) contours shown as solid (dashed) lines. For all the continuum maps and CO(4–3) maps of GN20.2a and GN20.2b, contours start at ±2σ in steps of 1σ. Beam sizes are displayed in the lower right corner of each integrated map.
Current usage metrics show cumulative count of Article Views (full-text article views including HTML views, PDF and ePub downloads, according to the available data) and Abstracts Views on Vision4Press platform.
Data correspond to usage on the plateform after 2015. The current usage metrics is available 48-96 hours after online publication and is updated daily on week days.
Initial download of the metrics may take a while.