Fig. 1
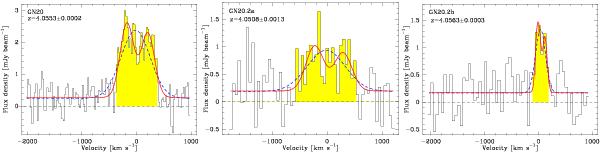
CO(4–3) spectra binned in steps of 25 km s-1 for GN20 (left), 50 km s-1 for GN20.2a (middle) and GN20.2b (right). The yellow color indicates the velocity ranges where line emission is detected. These regions have been used to derive the integrated fluxes. The red lines show best-fitting double Gaussian profiles to the spectra, and the blue dashed lines show the fits with a single Gaussian. Zero velocities correspond to the redshifts listed in Table 1.
Current usage metrics show cumulative count of Article Views (full-text article views including HTML views, PDF and ePub downloads, according to the available data) and Abstracts Views on Vision4Press platform.
Data correspond to usage on the plateform after 2015. The current usage metrics is available 48-96 hours after online publication and is updated daily on week days.
Initial download of the metrics may take a while.