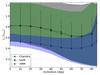
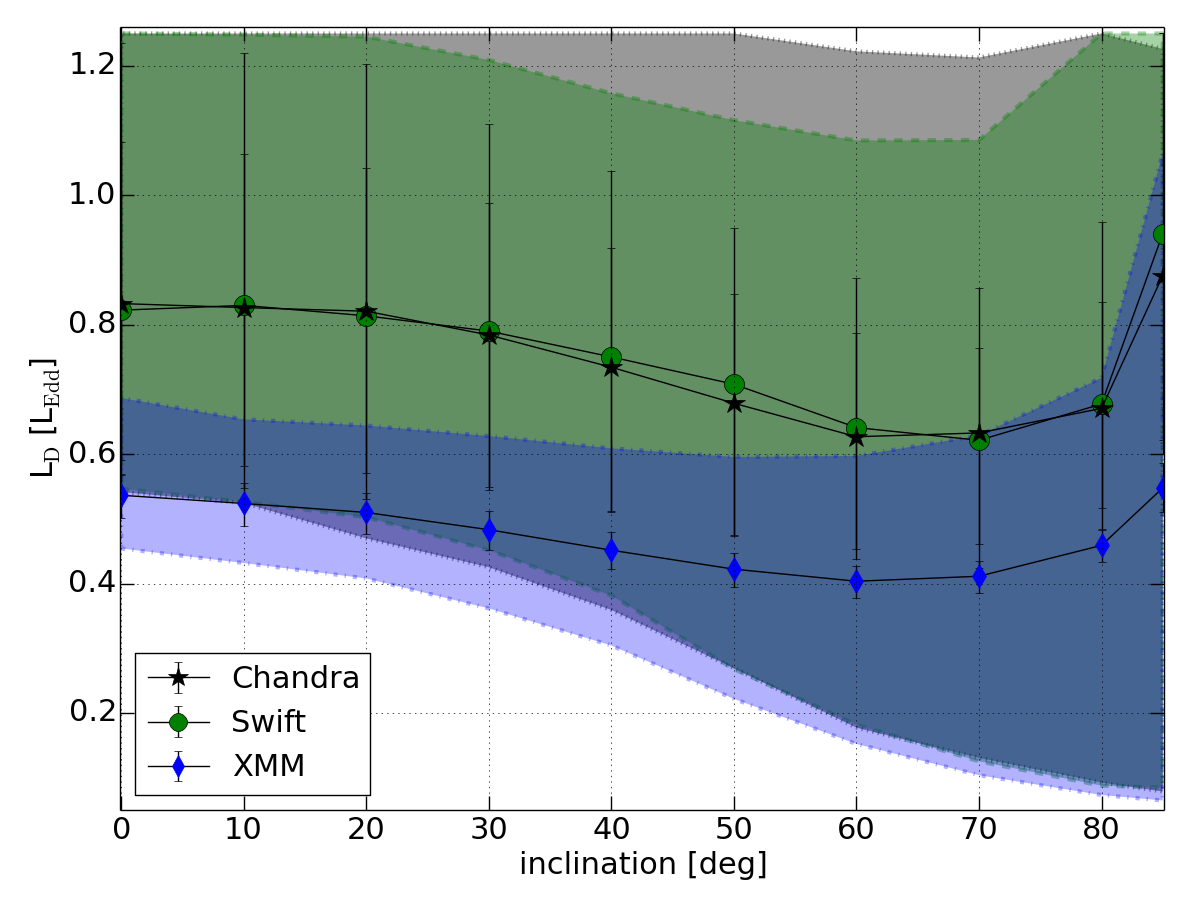
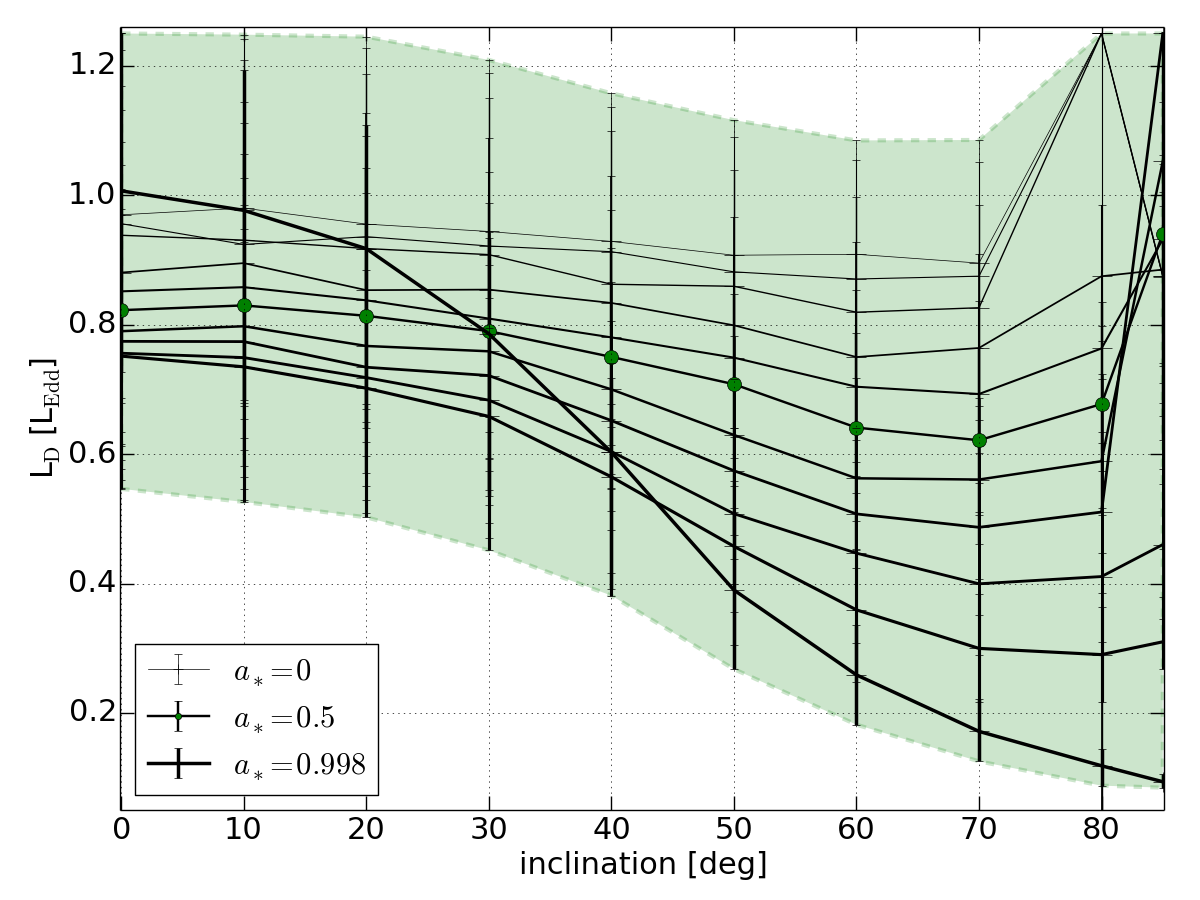
Fig. 4
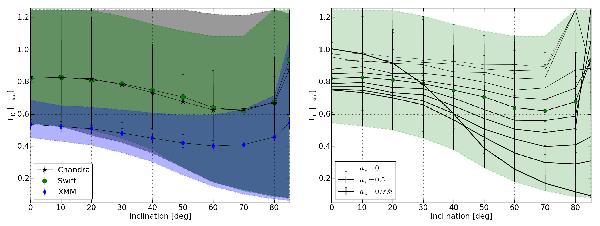
The disc luminosity in HLX-1. Left: the shaded areas indicate the 90% confidence interval for the luminosity distribution associated with the black hole mass measured in Fig. 3. Again, the the result for a∗ = 0.5 is singled out and given by the three solid lines (with 90% confidence), corresponding, respectively, to the Chandra (grey), Swift (green) and XMM (blue) spectrum. Right: the influence of the black hole spin on the luminosity of the Swift spectrum. Error bars give the 90% confidence interval.
Current usage metrics show cumulative count of Article Views (full-text article views including HTML views, PDF and ePub downloads, according to the available data) and Abstracts Views on Vision4Press platform.
Data correspond to usage on the plateform after 2015. The current usage metrics is available 48-96 hours after online publication and is updated daily on week days.
Initial download of the metrics may take a while.